Source page: McKinsey & Company
Commentary
A clean-fuels future
Decarbonization | Sustainability | North America
March 31, 2022 – As the energy sector transitions to net zero, some gas utilities in the United States could be uniquely positioned to convert their infrastructure into clean-fuels networks. Such a system could, for example, deliver hydrogen to industrial plants; transport carbon to and from carbon capture, utilization, and storage (CCUS) sites; and support an expanded low-carbon electricity grid.
To read the article, see “Decarbonizing US gas utilities: The potential role of a clean-fuels system in the energy transition,” March 2, 2022.
customizer here
Visual form
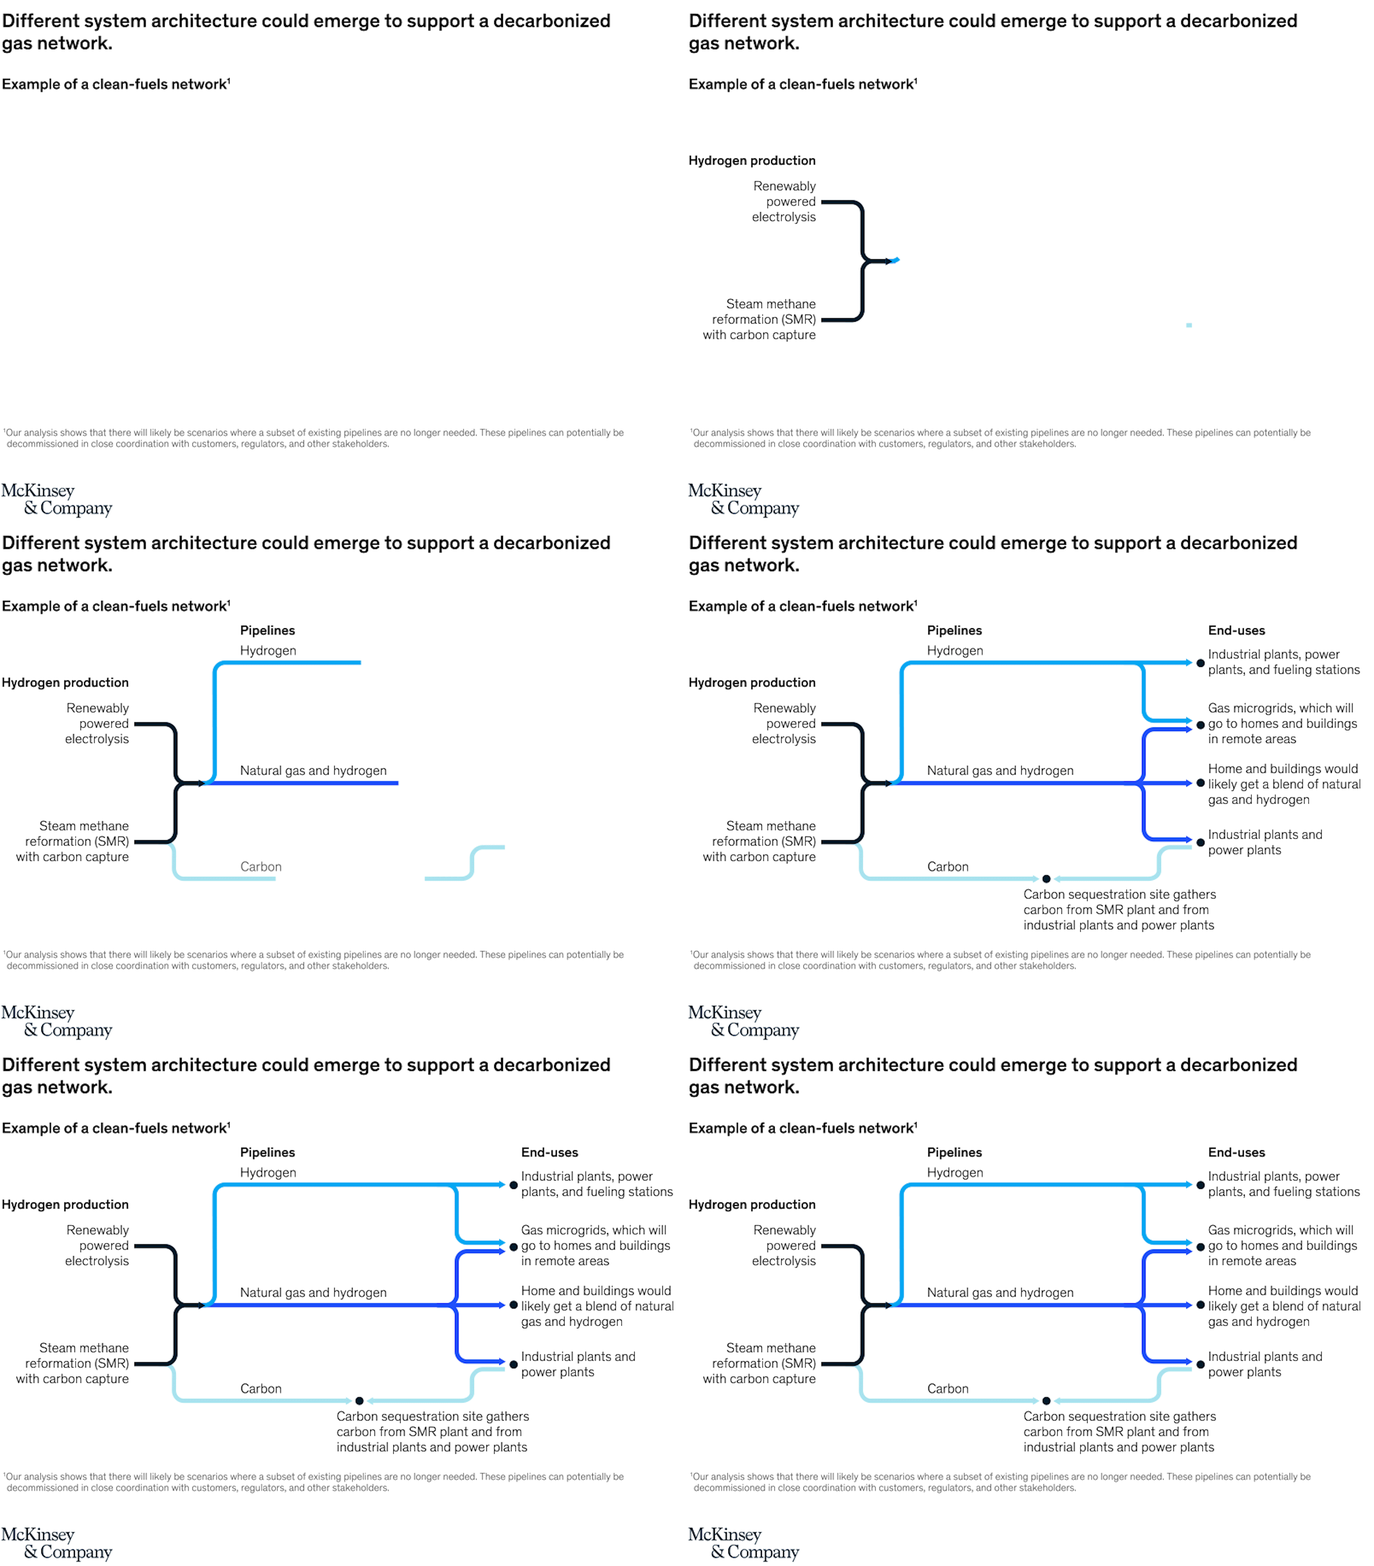
Network flow diagram.
Layout / body structure
The chart reads left to right as an infrastructure map. Hydrogen production sources start on the left, the pipeline architecture runs through the middle in several colored lanes, and end uses sit on the right, while a carbon loop drops to the bottom and routes into sequestration.
What is being compared
The diagram compares different fuel and carbon pathways inside a future clean-fuels network rather than comparing numerical series. It contrasts hydrogen, a natural-gas-and-hydrogen blend, and carbon-capture flows, and it also distinguishes the end uses served by each pathway, including industrial plants, power plants, fueling stations, remote-area gas microgrids, and buildings.
Measurement system
There is no numeric axis on this chart. The reader tracks labeled pathways, directional arrows, and color-coded network roles, so the key measurement system is categorical: which stream is moving, where it branches, and what destination it serves.
Visible structure inside the graphic
Two hydrogen-production inputs on the left feed into a central set of pipes, with a bright blue hydrogen lane across the top, a darker blue blended natural-gas-and-hydrogen lane through the middle, and a pale carbon lane running below. Branch points near the right side split the network into separate end-use destinations, while the carbon route continues downward into a sequestration site.
Main takeaway from the visual
The page makes the future gas network look less like a single replacement system and more like a reconfigured multi-lane architecture. Pure hydrogen, blended fuel, and captured carbon each move through distinct routes, which shows how existing gas infrastructure could be repurposed to support several decarbonized end-use cases at once.
Key standout values or extremes
The most prominent structural extreme is the top hydrogen-only route feeding industrial plants, power plants, and fueling stations, while the middle blended-fuel route is positioned as the path most likely to keep serving homes and buildings. The bottom carbon lane is visually separated from the fuel-delivery paths, emphasizing that carbon handling becomes its own dedicated system ending at sequestration rather than another consumption node.
Controls / sequence, when applicable
This is a static chart image with no in-chart controls to operate.
Companion media, when applicable
There is no separate companion audio or video; the chart image is the full visual on this page.