Source page: McKinsey & Company
Commentary
Green steely resolve
Sustainability | Climate change
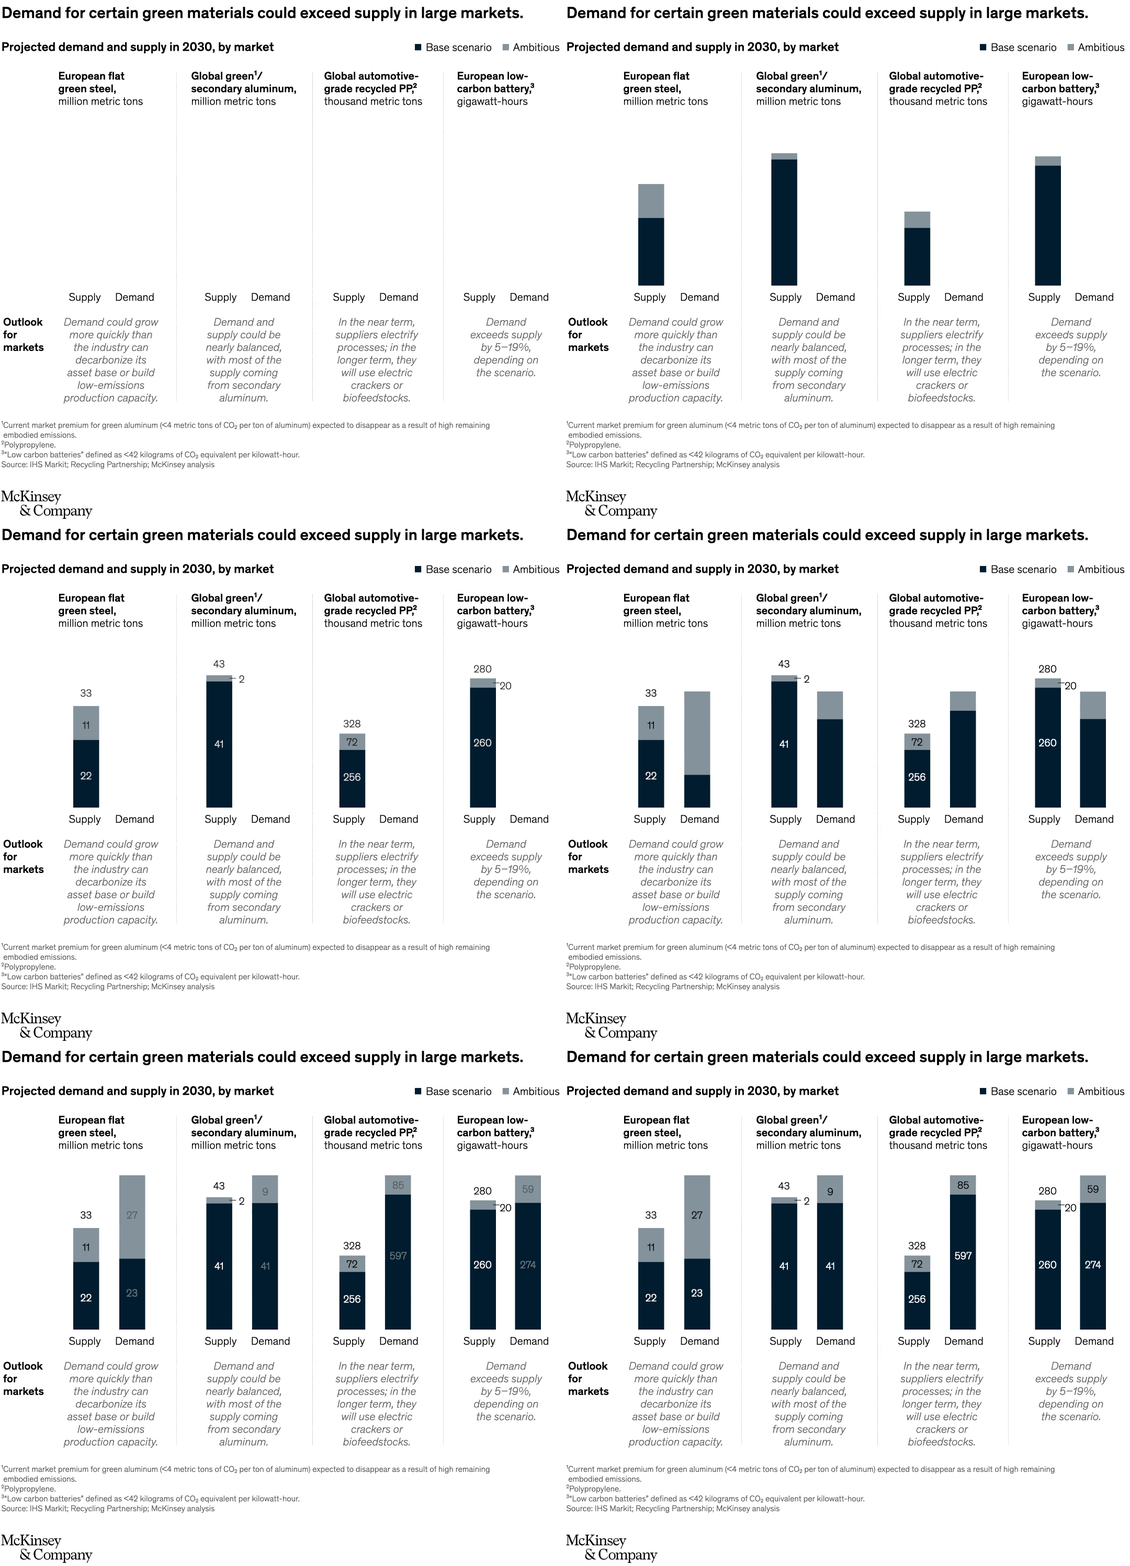
March 28, 2022 – Many companies are committing to lowering their carbon footprints but first need to find the resources to do so. The addition of more than a dozen green-steel factories in Europe by 2030 still may not be enough to meet demand of up to 50 million metric tons per year to meet EU emissions reduction targets. The output of materials such as recycled aluminum and plastic may also struggle to keep up with resource demands.
To read the article, see “It’s not easy buying green: How to win at sustainable sourcing,” February 25, 2022.
customizer here
Visual form
Four-panel stacked supply-versus-demand comparison chart.
Layout / body structure
The chart is arranged as four narrow vertical panels placed side by side, one for each material category. Inside every panel, a supply bar and a demand bar sit next to each other, and each bar is split into two stacked components, so the reader moves left to right across the four materials and reads supply before demand inside each panel.
What is being compared
The chart compares projected supply and demand for European flat green steel, global green or secondary aluminum, global automotive-grade recycled polypropylene, and European low-carbon battery output. It is comparing shortages across materials rather than changes through time.
Measurement system
Each panel uses the material-specific unit printed in its heading: million metric tons for steel and aluminum, thousand metric tons for recycled polypropylene, and gigawatt-hours for batteries. The numbers written inside or above the stacked bars are the key anchors, and the two shades separate the components that add up to each supply or demand total.
Visible structure inside the graphic
Every material panel repeats the same structure: a darker base segment with a lighter top segment on the supply bar, and the same two-part stack on the demand bar beside it. Thin dividers separate the four markets, so the eye can compare not only the total bar heights but also how the composition of each total shifts from supply to demand.
Main takeaway from the visual
Demand is taller than supply in all four panels, so every material category is shown in deficit rather than balance. The widest visual gaps appear in European flat green steel and in automotive-grade recycled polypropylene, where the demand bars extend much farther above the available supply than they do in aluminum or low-carbon batteries.
Key standout values or extremes
European flat green steel shows 33 of supply against 50 of demand, while automotive-grade recycled polypropylene shows 328 of supply against 682 of demand, the largest absolute shortfall on the page. Aluminum is the closest to balance at 43 versus 50, and low-carbon batteries still show a visible gap at 280 versus 333.
Controls / sequence, when applicable
This is a static chart image with no in-chart controls to operate.
Companion media, when applicable
There is no separate companion audio or video; the chart image is the full visual on this page.