Source page: McKinsey & Company
Commentary
China makes, the world takes
Logistics | China
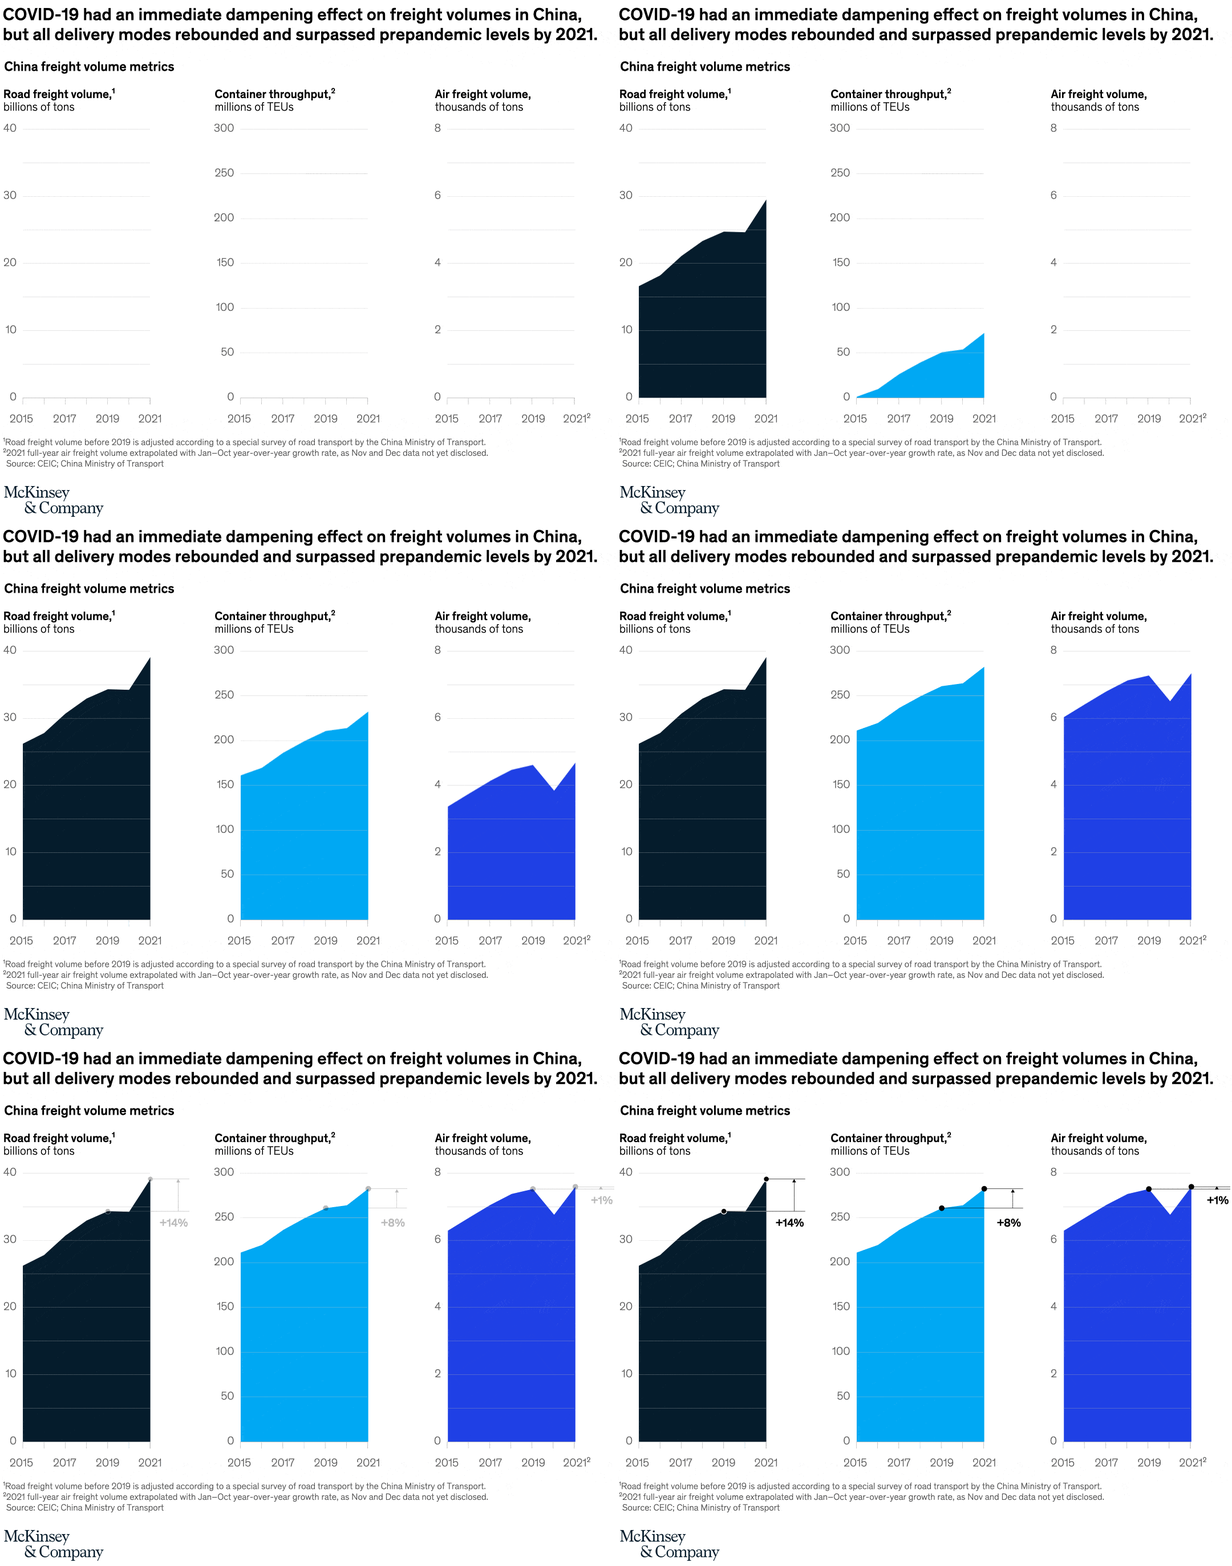
March 24, 2022 – If you’re a logistics provider, chances are 2021 was a profitable year. Amid the pandemic, spending shifted from services to goods—many of them made in China—for example, to upgrade their homes and convert their living spaces to offices. Shipping volumes in China soared across all modes last year, including road freight, container, and air freight.
To read the article, see “Five things to know about the Chinese logistics market heading into 2022,” February 25, 2022.
customizer here
Visual form
Three-panel time-series area chart comparison.
Layout / body structure
The chart places three area charts side by side on matching five-point time spans from 2015 to 2021. Reader moves left to right from road freight to container throughput to air freight, using the shared panel structure to compare how each logistics measure changed over the same years.
What is being compared
The chart compares three freight measures in China: road freight volume, container throughput, and air freight volume. It is comparing transport modes against each other while also showing how each one changed from mid-decade to 2021.
Measurement system
Each panel uses its own unit printed in the title: billions of tons for road freight, millions of TEUs for container throughput, and thousands of tons for air freight. Endpoint callouts on the right summarize the cumulative change, so the reader tracks both the height of the filled area and the percentage gain label.
Visible structure inside the graphic
Each panel shows a filled colored area rising along a horizontal time axis with marker dots at key years. A bracketed arrow and bold percentage callout sit at the right edge of every panel, which turns the chart into a three-way side-by-side comparison of end-state growth rather than a single continuous plot.
Main takeaway from the visual
Road freight and container throughput both rise meaningfully across the period, while air freight ends the period almost flat by comparison. The left and middle panels finish well above where they begin, but the right panel oscillates and lands with only a minimal gain, making it the clear laggard of the three.
Key standout values or extremes
The biggest visible gain is road freight at +14 percent, followed by container throughput at +8 percent. Air freight posts only +1 percent, which is the smallest endpoint change and the weakest finishing trajectory on the page.
Controls / sequence, when applicable
This is a static chart image with no in-chart controls to operate.
Companion media, when applicable
There is no separate companion audio or video; the chart image is the full visual on this page.