Source page: McKinsey & Company
Commentary
Keep in touch
Industrial machinery | Digital
March 22, 2022 – Sixty years after the world first heard about “power by the hour,” aftermarket services is still an underexplored source of revenue for many companies. From software and spare parts to additional services and extended warranties, these aftermarket opportunities are worth billions. Consider medical technologies, where companies that successfully accelerated services have dramatically boosted enterprise values.
To read the article, see “Five digital and analytics battlegrounds for B2B aftermarket growth,” February 17, 2022.
customizer here
Visual form
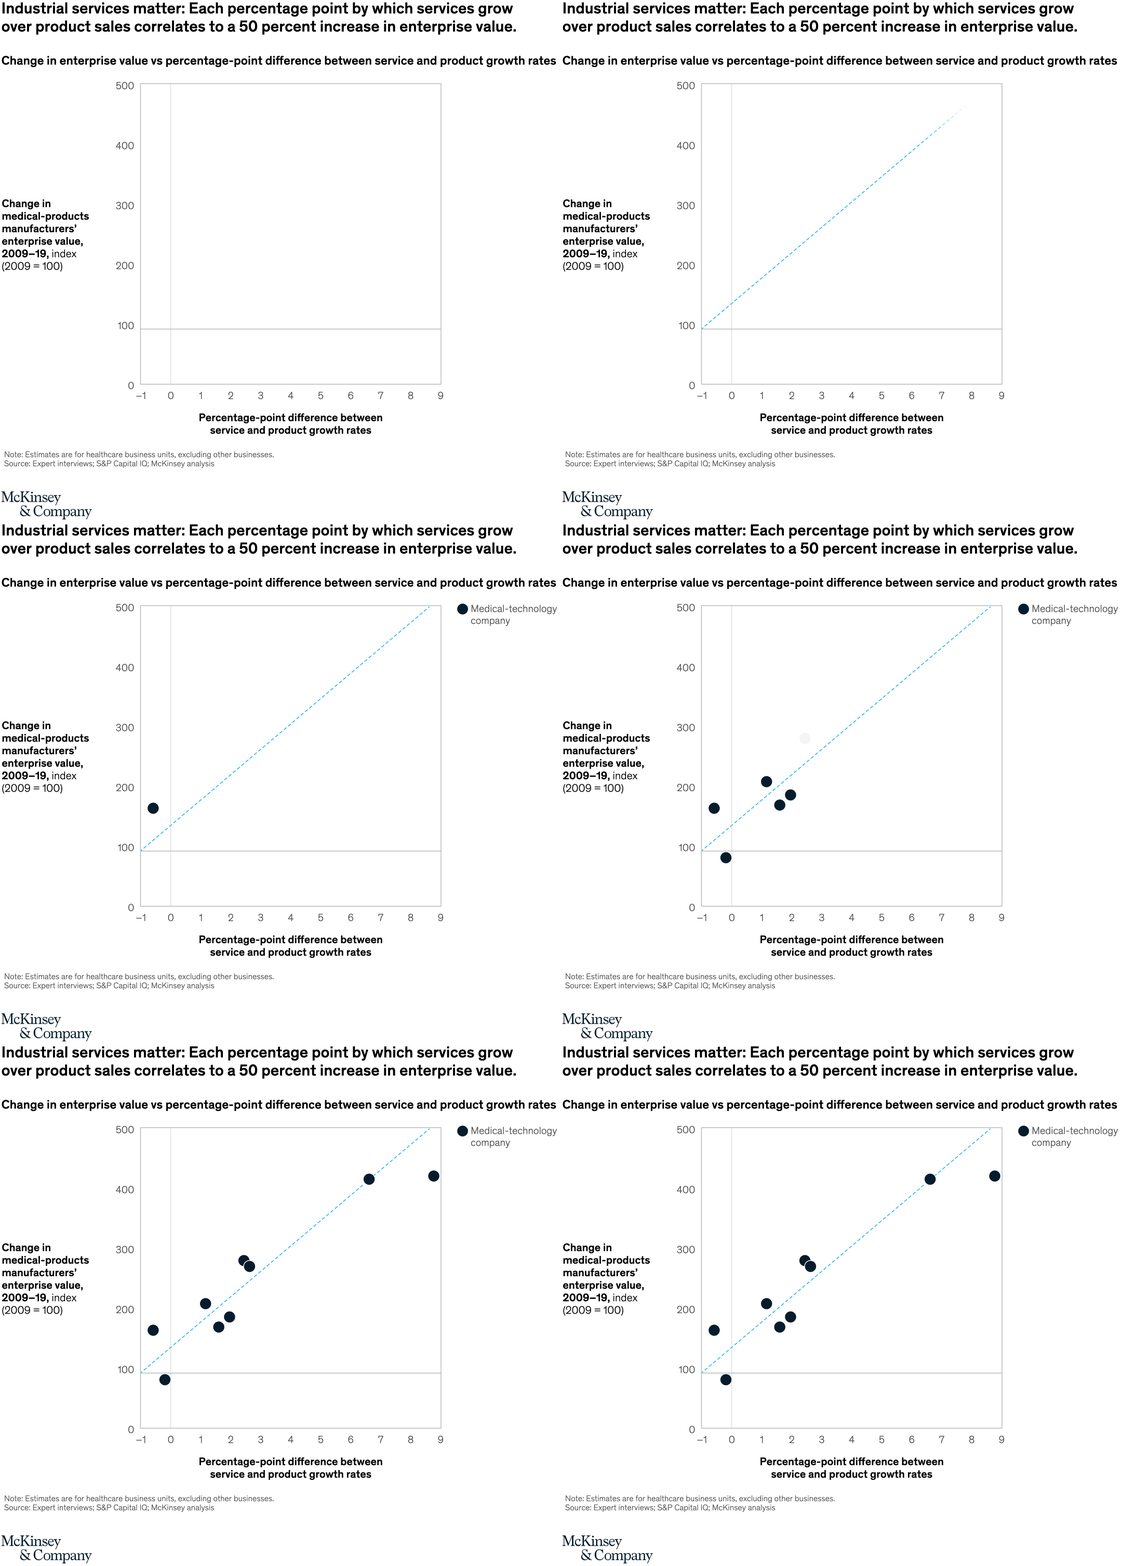
Scatter plot with an upward trend relationship.
Layout / body structure
The chart is a single x-y plot with the title across the top, the value axis running up the left side, and the growth-difference axis running along the bottom. Reader starts with the axes and then reads the plotted company markers and fitted upward relationship from lower left toward upper right.
What is being compared
The chart compares medical-products manufacturers by plotting the percentage-point difference between service growth and product growth against the change in enterprise value from 2009 to 2019. It is comparing business-model mix on the horizontal axis and value creation on the vertical axis.
Measurement system
The vertical axis is an enterprise-value index with 2009 set to 100, and the scale shown on the page rises through 300 and 400 to 500. The horizontal axis measures the percentage-point gap between service growth and product growth, so rightward movement means services are outgrowing products by a wider margin.
Visible structure inside the graphic
The plot area uses company markers placed against an upward sloping fitted relationship, and one medical-technology company is called out high in the upper-right portion of the chart. The headline equation sits above the graph and frames the plotted relationship as the central message of the chart rather than as a side note.
Main takeaway from the visual
The visual shows a positive relationship between faster service growth and stronger enterprise-value growth. Companies positioned farther to the right on the service-growth axis also tend to sit higher on the value axis, so the chart reads as a clear upward correlation rather than a flat or noisy relationship.
Key standout values or extremes
The headline claim is that each percentage point by which services outgrow product sales correlates to a 50 percent increase in enterprise value. On the vertical scale, the plot stretches from the 100 baseline up toward 500, and the labeled medical-technology company sits well above the midrange in the upper part of the chart.
Controls / sequence, when applicable
This is a static chart image with no in-chart controls to operate.
Companion media, when applicable
There is no separate companion audio or video; the chart image is the full visual on this page.