Source page: McKinsey & Company
Commentary
Taking carbon out of carmaking
Automotive | Sustainability
March 21, 2022 – Road transport is a huge contributor to global emissions of greenhouse gases. To keep pace with the broad effort to limit warming to 1.5 degrees C, the sector is moving quickly to embrace a set of changes across its products and processes.
To read the article, see “Mobility’s rebound: An industry recovers, but where is it heading?”, December 20, 2021.
customizer here
Visual form
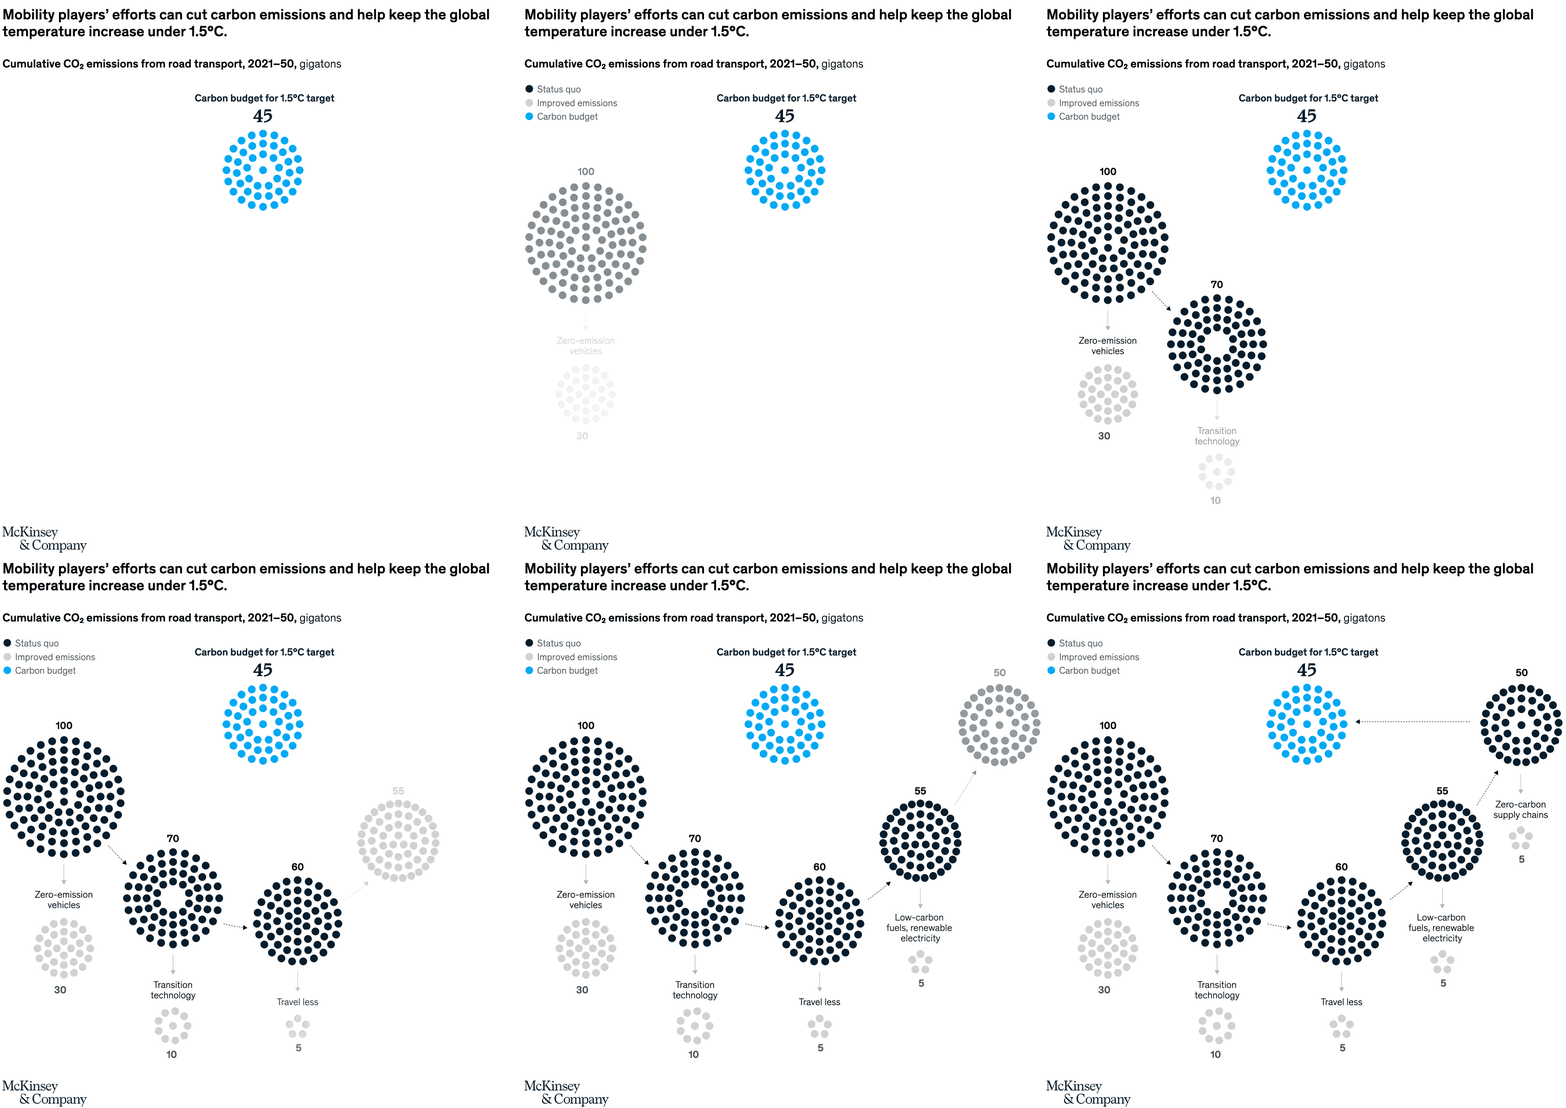
Decarbonization wedge and reduction-step chart.
Layout / body structure
The chart is a single left-to-right emissions-reduction build with the status-quo total on one side, the carbon-budget target on the other, and five labeled intervention wedges placed between them. Reader starts at the full road-transport emissions total and then moves across the labeled reduction blocks to see how the gap can be closed.
What is being compared
The chart compares cumulative road-transport CO2 emissions under the status quo with the carbon budget compatible with a 1.5 degrees C pathway. Between those endpoints it breaks out the contribution of travel reduction, transition technology, low-carbon fuels and renewable electricity, zero-emission vehicles, and zero-carbon supply chains.
Measurement system
The unit is cumulative CO2 emissions from road transport from 2021 to 2050, measured in gigatons. The large endpoint totals anchor the comparison, while the labeled intervention blocks show how much emissions reduction each lever can contribute toward the lower carbon-budget level.
Visible structure inside the graphic
The page organizes the decarbonization levers as separate colored blocks sized to their contribution, so the chart reads like a stack of wedges closing the distance between two totals. The biggest intervention labels sit inside the larger blocks, while smaller cuts such as travel less and transition technology occupy visibly thinner slices lower in the build.
Main takeaway from the visual
The chart shows that road transport cannot reach the lower carbon budget through one lever alone; it takes several sizable wedges working together to pull emissions down from the status-quo level. Zero-emission vehicles and low-carbon fuels with renewable electricity are the visually dominant contributors, while the remaining wedges still matter to finish the gap closure.
Key standout values or extremes
The status-quo total is shown at 100 gigatons, while the carbon-budget level is marked in the mid-40s. Among the intervention wedges, zero-emission vehicles is labeled 70, low-carbon fuels and renewable electricity 60, zero-carbon supply chains 55, transition technology 30, and travel less 10, which makes travel reduction the smallest visible slice in the pathway.
Controls / sequence, when applicable
This is a static chart image with no in-chart controls to operate.
Companion media, when applicable
There is no separate companion audio or video; the chart image is the full visual on this page.