Source page: McKinsey & Company
Commentary
IRL versus URL
Digital | Healthcare
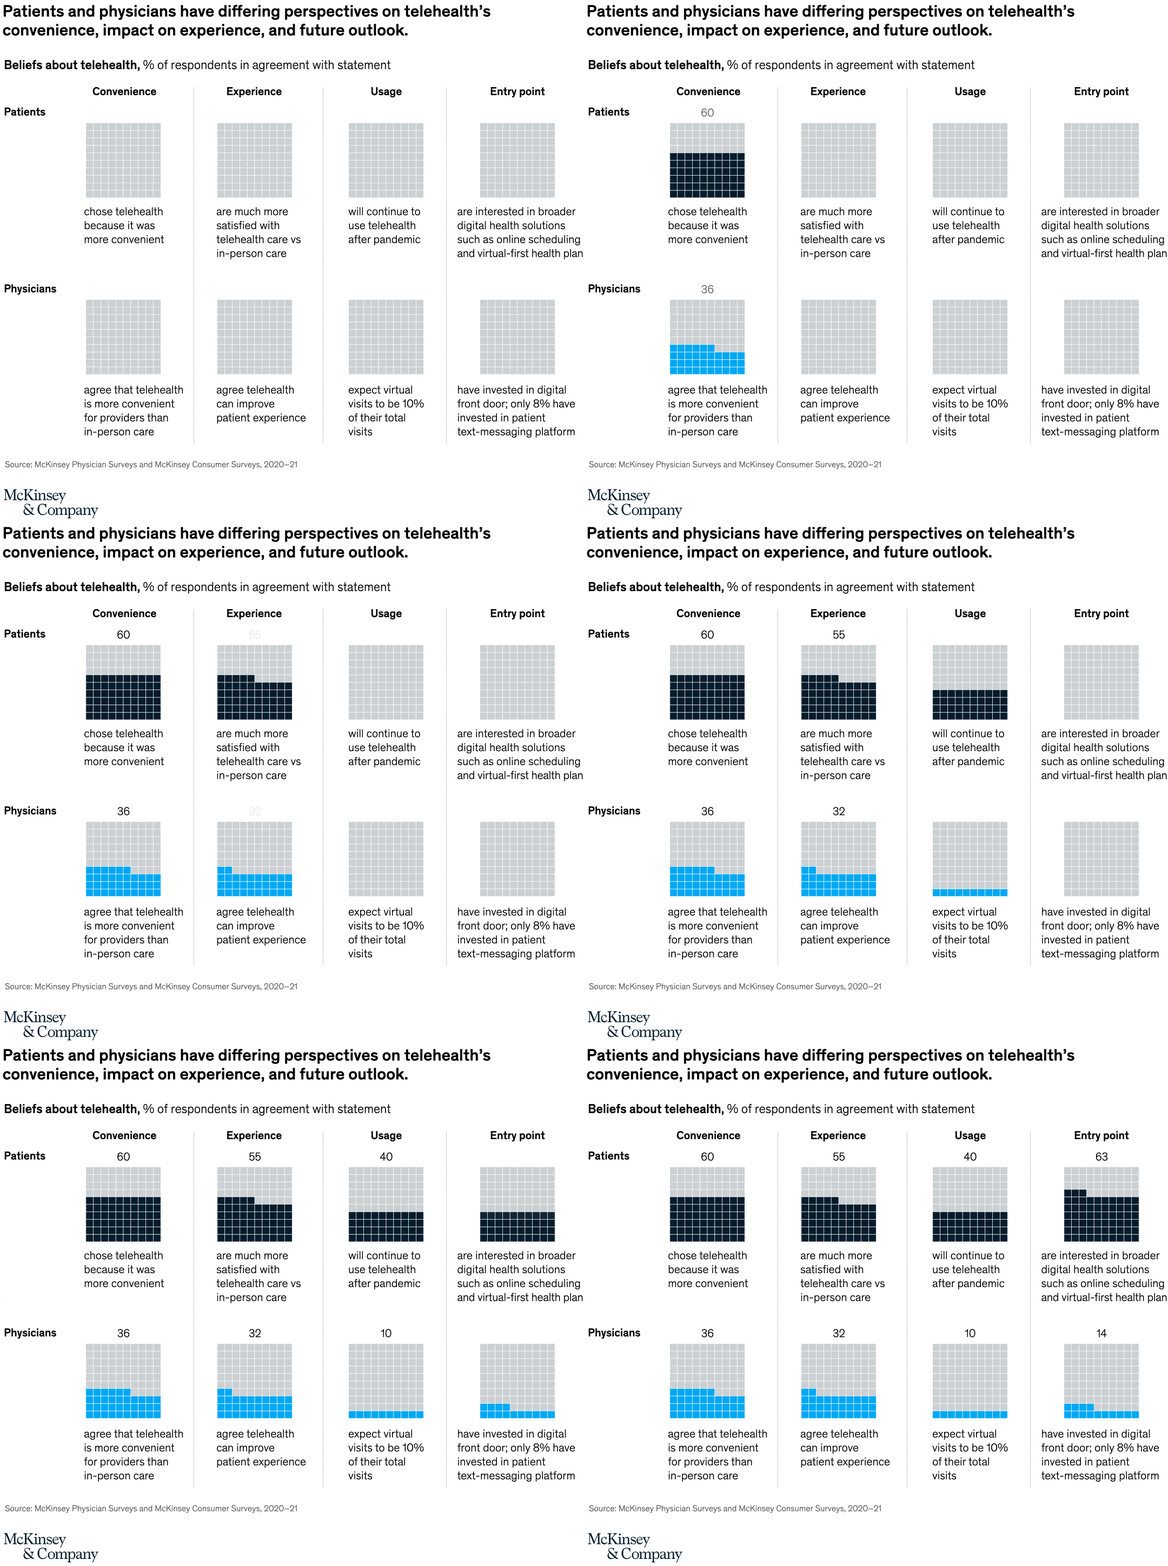
March 15, 2022 – There is a growing disconnect between patients and physicians when it comes to telehealth. While both sides embraced telehealth at the onset of the pandemic, this sentiment has changed—physicians may now prefer a return to prepandemic IRL (in real life) care. Our most recent McKinsey Physician Survey found that patients and physicians have starkly different opinions around convenience, experience, and future outlook.
To read the article, see “Patients love telehealth—physicians are not so sure,” February 22, 2022.
customizer here
Visual form
Two-row four-column respondent comparison chart.
Layout / body structure
The chart is laid out as four vertical topic columns with one patient row and one physician row. Reader moves left to right across convenience, experience, usage, and entry-point themes, comparing the top patient figure and statement with the lower physician figure and statement inside each column.
What is being compared
The chart compares how patients and physicians view telehealth across four themes: convenience, telehealth’s effect on experience, future usage, and openness to broader digital entry points. It is a side-by-side respondent-group comparison rather than a time series.
Measurement system
Each headline figure is a percent of respondents agreeing with the statement attached to that column. The percentages anchor the comparison, while the explanatory text beneath them spells out what each agreement measure means in practice for patients and physicians.
Visible structure inside the graphic
Each column has a short heading, a large patient percentage near the top, and a physician percentage lower down with paired explanatory sentences. The repeated two-row structure makes the gap between the two respondent groups easy to read, especially because the patient values are clustered high across all four columns.
Main takeaway from the visual
Patients are consistently more positive about telehealth than physicians across convenience, experience, future use, and digital front-door behavior. The top row reads as broadly favorable, while the lower physician row is visibly more skeptical and lower on willingness, expected usage, and perceived experience gains.
Key standout values or extremes
Patients register 60 percent on convenience, 55 percent on experience, 40 percent on continued use, and 63 percent on interest in broader digital health solutions. On the physician side, two of the clearest visible low points are 10 percent expecting virtual visits to account for 10 percent of total visits and 14 percent tied to digital front-door investment, which reinforces the gap between the two rows.
Controls / sequence, when applicable
This is a static chart image with no in-chart controls to operate.
Companion media, when applicable
There is no separate companion audio or video; the chart image is the full visual on this page.