Source page: McKinsey & Company
Commentary
Machines that teach themselves
Operations | Machine Learning
February 24, 2022 – When machines can adjust their performance autonomously based on historical and real-time data, that’s machine intelligence (MI). Together with researchers at Massachusetts Institute of Technology, we assessed companies on three attributes: the extent of their deployment of MI technologies, the enablers that they’ve put in place, and the results they’ve achieved. Some companies are significantly ahead of the rest—and are reaping the rewards.
To read the article, see “Toward smart production: Machine intelligence in business operations,” February 1, 2022.
customizer here
Visual form
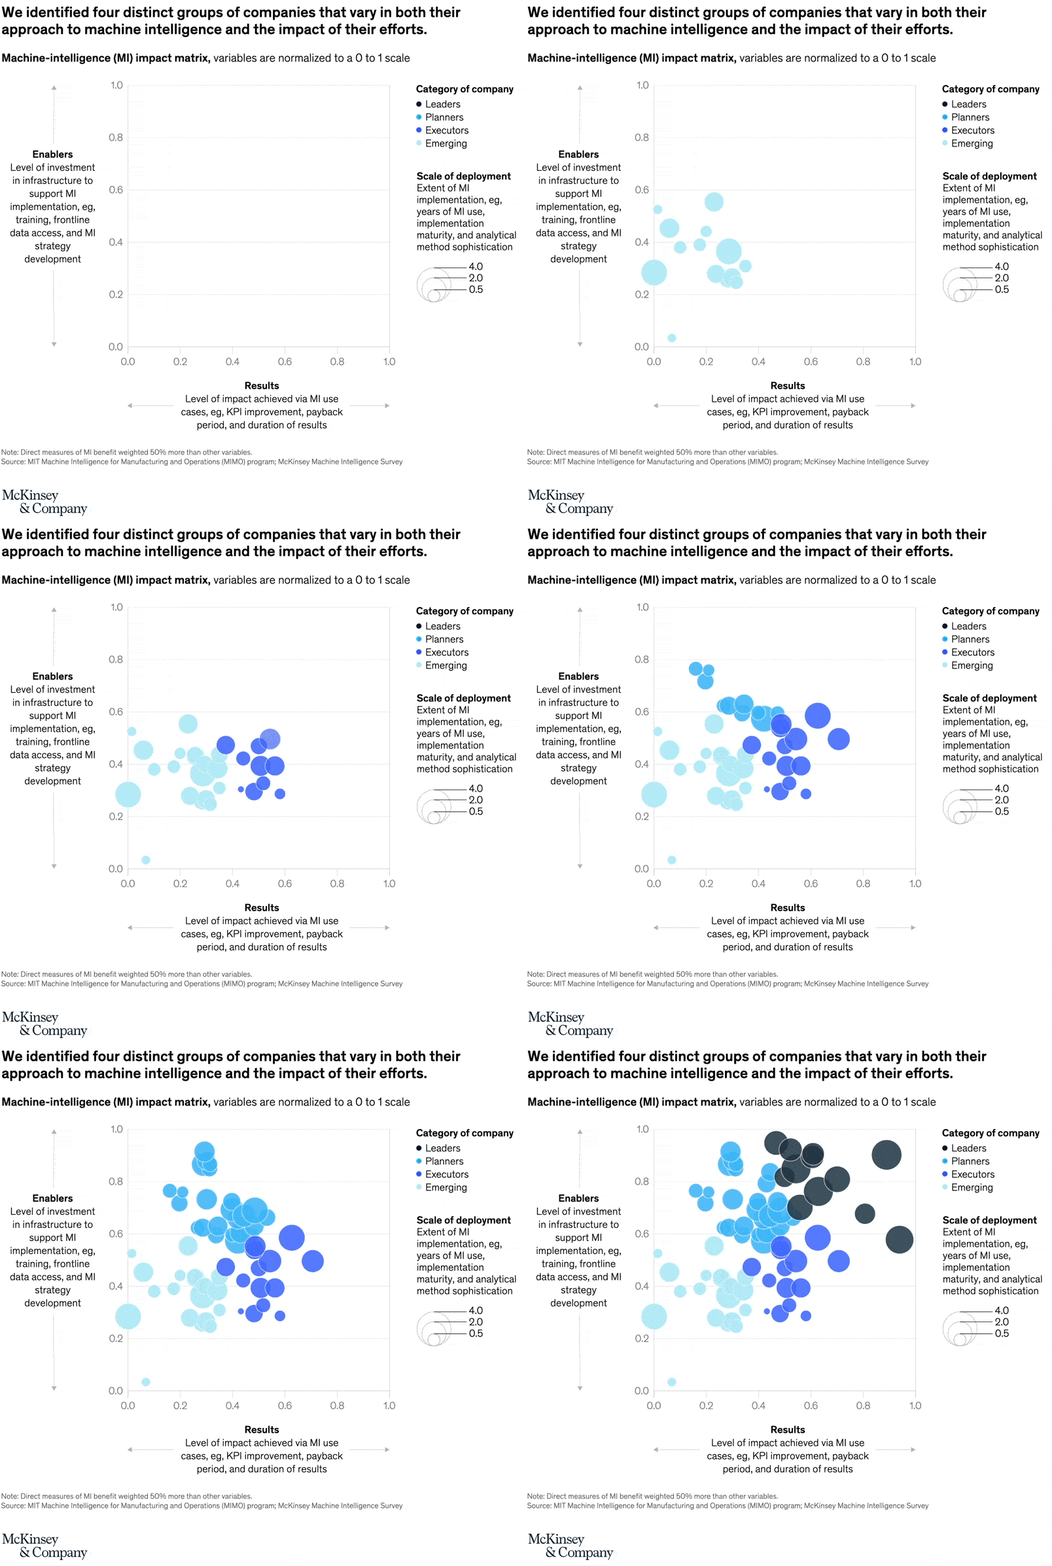
Impact-matrix scatter plot.
Layout / body structure
The chart is a single square matrix with the plot in the center, axis explanations around the frame, and a legend identifying four company groups. Reader scans the clusters inside the matrix first and then uses the side notes to decode what the vertical and horizontal dimensions represent.
What is being compared
The chart compares four groups of companies – leaders, planners, executors, and emerging enablers – by both their approach to machine intelligence and the impact achieved from that work. It is comparing level of machine-intelligence implementation against level of business impact rather than following a time series.
Measurement system
Both dimensions are shown on a normalized 0 to 1 scale. The vertical dimension bundles investment in infrastructure, scale of deployment, extent of implementation, and development maturity, while the horizontal dimension tracks impact achieved through use cases, KPI improvement, payback period, and duration of results.
Visible structure inside the graphic
Colored clusters sit in different parts of the matrix, with leaders concentrated toward the upper-right and the other groups stepping down and left from there. The chart also adds text blocks around the frame to explain the maturity inputs on one side and the results inputs on the other, so the plot reads as a two-factor capability-versus-impact map.
Main takeaway from the visual
Leaders occupy the strongest part of the matrix because they pair higher machine-intelligence maturity with higher realized impact, while the other groups fall away from that corner. The chart makes the spread between company types look structural rather than marginal, since the clusters separate across both axes at once.
Key standout values or extremes
The most visible extremes are the matrix endpoints themselves, with the axes running from 0.0 up to 1.0. Leaders sit closest to the top-right end of that range, while emerging enablers sit much lower and farther left, which marks the widest visual gap on the page.
Controls / sequence, when applicable
This is a static chart image with no in-chart controls to operate.
Companion media, when applicable
There is no separate companion audio or video; the chart image is the full visual on this page.