Source page: McKinsey & Company
Commentary
The cost will not be net zero
Sustainability
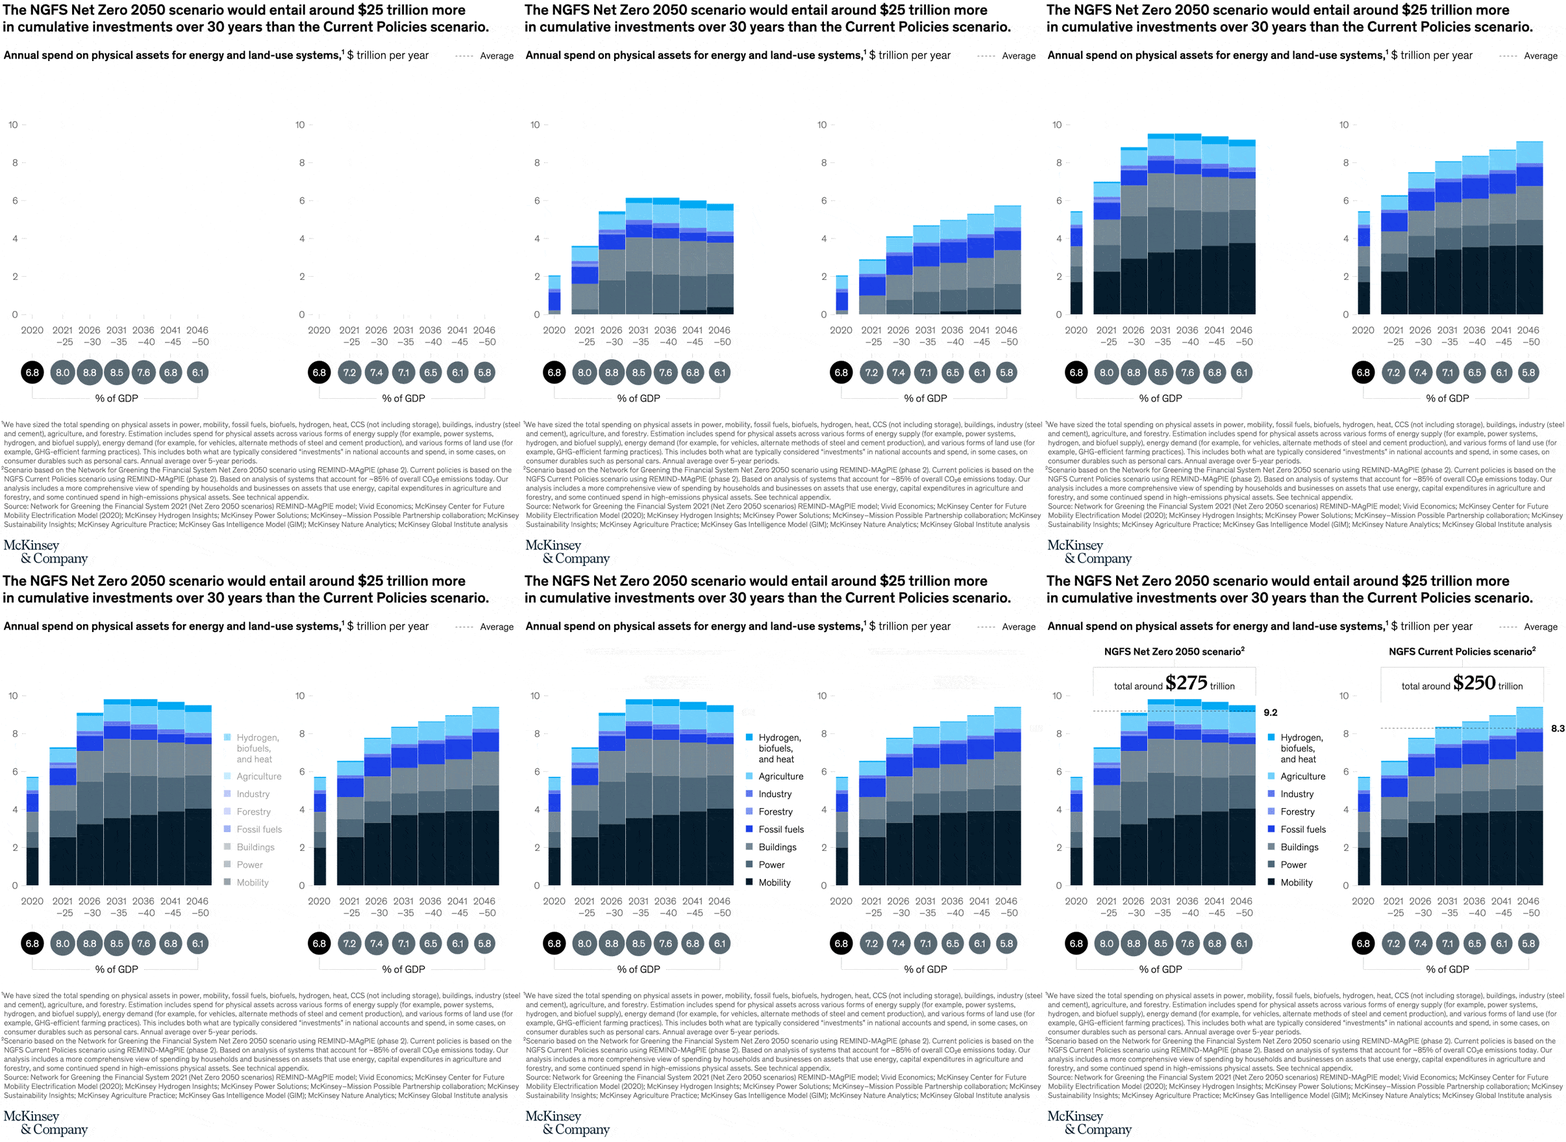
February 18, 2022 – How much will the net-zero transition cost? Our analysis of the industry-standard scenario for net zero by 2050 suggests that about $275 trillion in cumulative spending on physical assets, or approximately $9.2 trillion per year, would be needed between 2021 and 2050. That’s $25 trillion more than the current-policies scenario. Every sector and every time frame would see a bigger bill.
To read the article, see “The economic transformation: What would change in the net-zero transition,” January 25, 2022.
customizer here
Visual form
Scenario comparison chart.
Layout / body structure
The chart is a single wide comparison with the Net Zero 2050 scenario and the Current Policies scenario presented against the same long time horizon. Reader takes in the two scenario totals first and then reads across the sector breakdown beneath them from power through mobility, buildings, fossil fuels, industry, agriculture, forestry, and hydrogen-related categories.
What is being compared
The chart compares cumulative and annual investment requirements under two different transition pathways: the NGFS Net Zero 2050 scenario and the NGFS Current Policies scenario. It also compares how those investment differences distribute across major sectors of the economy.
Measurement system
The page uses dollar values in trillions for investment totals and also references investment as a share of GDP. The strongest visible anchors are total investments of around 275 trillion dollars in the Net Zero 2050 case versus around 250 trillion dollars in the Current Policies case, which creates the roughly 25 trillion dollar gap named in the headline.
Visible structure inside the graphic
The visual combines scenario totals with a sector-by-sector breakdown, so it reads as both a headline comparison and a decomposition of where the differences come from. Category labels along the bottom identify which sectors add to investment needs and which sectors, such as fossil fuels, show negative deltas relative to the net-zero path.
Main takeaway from the visual
The transition does not make total investment disappear; it reallocates and lifts it, with the net-zero pathway requiring materially more cumulative investment than current policies. The chart makes that extra cost look broad-based because the gap is tied to multiple sectors rather than a single outlier bucket.
Key standout values or extremes
The headline figure is the roughly 25 trillion dollar difference in cumulative investments over 30 years. The page also shows total investment around 275 trillion dollars for Net Zero 2050 versus about 250 trillion dollars for Current Policies, while fossil fuels are one of the clearest negative contribution categories on the sector strip.
Controls / sequence, when applicable
This is a static chart image with no in-chart controls to operate.
Companion media, when applicable
There is no separate companion audio or video; the chart image is the full visual on this page.