Source page: McKinsey & Company
Commentary
Digital slam dunk
Retail
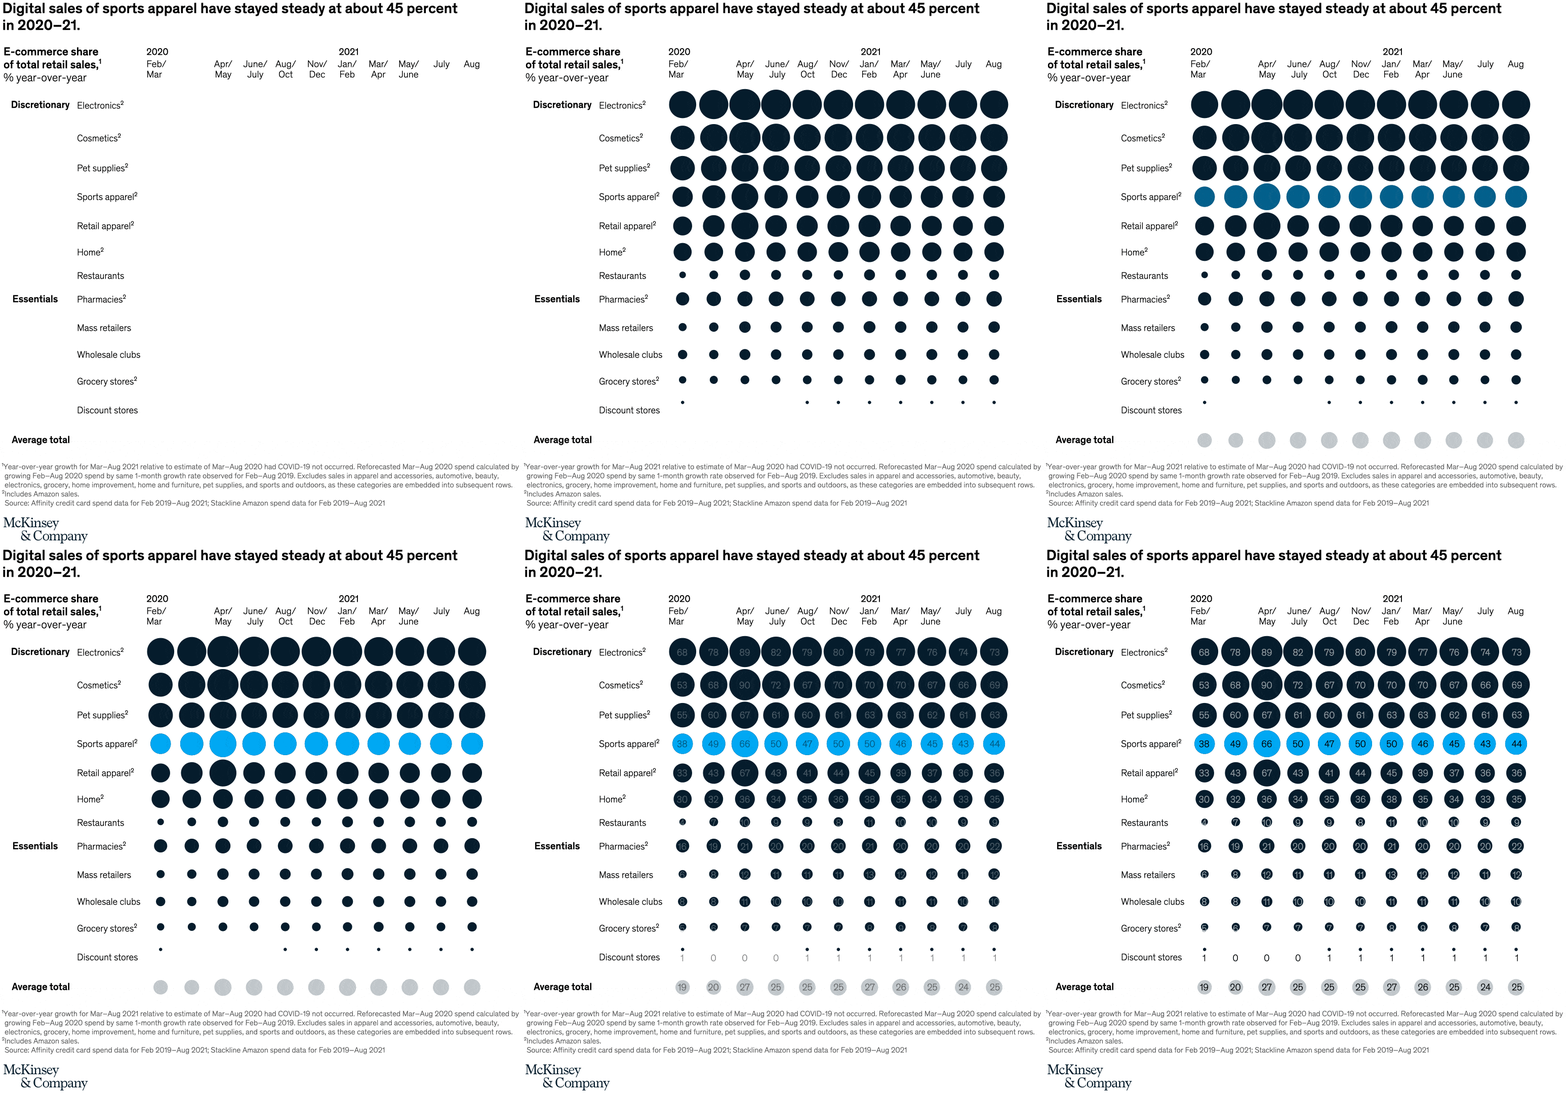
February 15, 2022 – The sporting-goods industry has already returned to pre-COVID-19 growth levels. E-commerce spending on sports apparel has sustained at about 40–50 percent since the pandemic began. Companies that prioritize direct-to-consumer models and those that focus on omnichannel offerings will be best positioned for the coming year.
To read the article, see “Sporting goods 2022: The new normal is here,” January 24, 2022.
customizer here
Visual form
Table with visual encoding.
Layout / body structure
The chart is a category-by-month matrix with retail categories listed down the left side and time periods running across the top. Reader scans horizontally across each category row, then compares rows vertically to see which sectors sustained the biggest digital-sales shares through 2020 and 2021.
What is being compared
The table compares e-commerce share of total retail sales across categories such as discretionary electronics, cosmetics, pet supplies, sports apparel, retail apparel, home, restaurants, pharmacies, mass retailers, wholesale clubs, grocery stores, and discount stores. It is comparing categories over time rather than showing one aggregate digital-sales number.
Measurement system
Each cell is a percentage value, and the page frames the grid around e-commerce share of total retail sales with year-over-year context. The sports-apparel row is the headline focus, but the same percentage system is used across every retail category in the table.
Visible structure inside the graphic
The page uses a matrix layout where each category forms one row and each survey month or period forms one column, with the percentages written directly into the grid. The sports-apparel row sits near the middle of the table and can be read across against neighboring categories, while the top rows for electronics and cosmetics remain visibly higher.
Main takeaway from the visual
Digital sales in sports apparel stay elevated rather than snapping back toward old levels, which is why the headline calls out a steady share around 45 percent. The table also makes clear that sports apparel sits below the most digital-heavy categories but still well above many essential-retail channels.
Key standout values or extremes
The sports-apparel row shows readings clustered around the mid-40 percent range, including a 45 percent anchor in the headline treatment. Discretionary electronics sits much higher, reaching the 70s and 80s in several cells, while grocery and wholesale-club rows remain down near the low end of the grid.
Controls / sequence, when applicable
This is a static chart image with no in-chart controls to operate.
Companion media, when applicable
There is no separate companion audio or video; the chart image is the full visual on this page.