Source page: McKinsey & Company
Commentary
Private players stake their place in space
Space | R&D
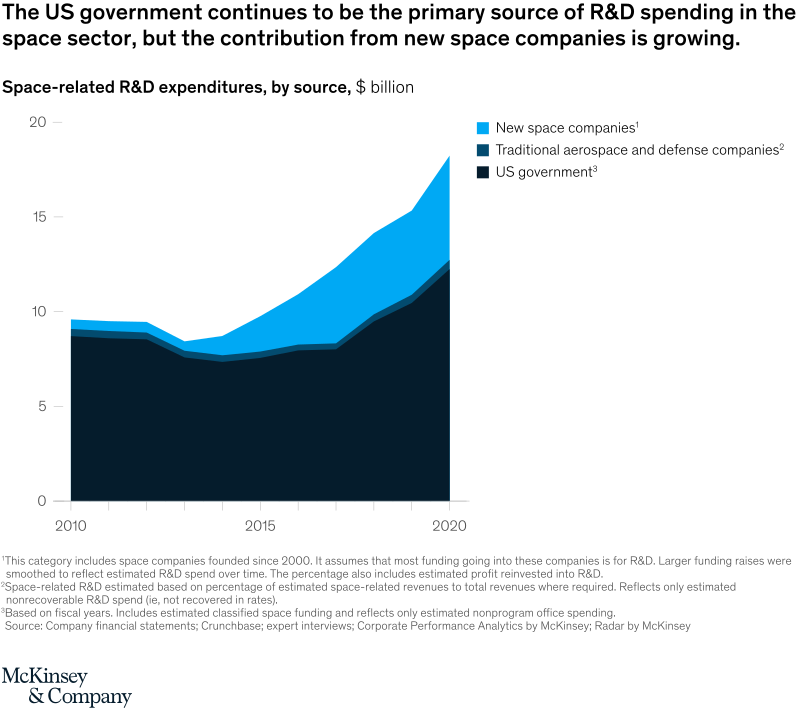
February 7, 2022 – While the US government still funds the biggest chunk of space-sector R&D, private companies are increasing their investments. Investment in new space companies now accounts for an estimated $5 billion to $6 billion per year in space R&D funding—up from less than $1 billion in 2010.
To read the article, see “R&D for space: Who is actually funding it?,” December 10, 2021.
customizer here
Visual form
Stacked area chart.
Layout / body structure
The chart is a single stacked time-series chart running from 2010 to 2020, with the funding sources layered on top of one another. Reader moves left to right through time while watching how the thickness of the US-government, traditional-aerospace, and new-space-company bands changes within the total stack.
What is being compared
The chart compares space-related research-and-development expenditures by source: the US government, traditional aerospace and defense companies, and new space companies. It is comparing who funds space R&D and how that funding mix changes over time.
Measurement system
The vertical axis is measured in billions of dollars of space-related R&D spending. The chart tops out at 20 billion dollars, so the reader is tracking both total stack height and the relative contribution of each funding source within that total.
Visible structure inside the graphic
Three colored bands stack upward across the decade, with the US-government layer forming the largest base, the traditional-aerospace layer sitting above it, and the new-space layer widening near the top over time. The chart’s structure makes it easy to see both the persistence of the government base and the gradual growth of the newer private layer.
Main takeaway from the visual
The US government remains the dominant source of space-sector R&D spending, but private participation from new space companies is clearly increasing. The widening top band for new space is the page’s key visual signal that the funding mix is evolving even though the public sector still anchors the stack.
Key standout values or extremes
The total stack approaches the high teens on the 20-billion-dollar scale by the end of the chart. The clearest extreme is the persistent dominance of the government layer across the full period, contrasted with the visibly smaller but expanding new-space layer by 2020.
Controls / sequence, when applicable
This is a static chart image with no in-chart controls to operate.
Companion media, when applicable
There is no separate companion audio or video; the chart image is the full visual on this page.