Source page: McKinsey & Company
Commentary
Banks get bypassed
Banking
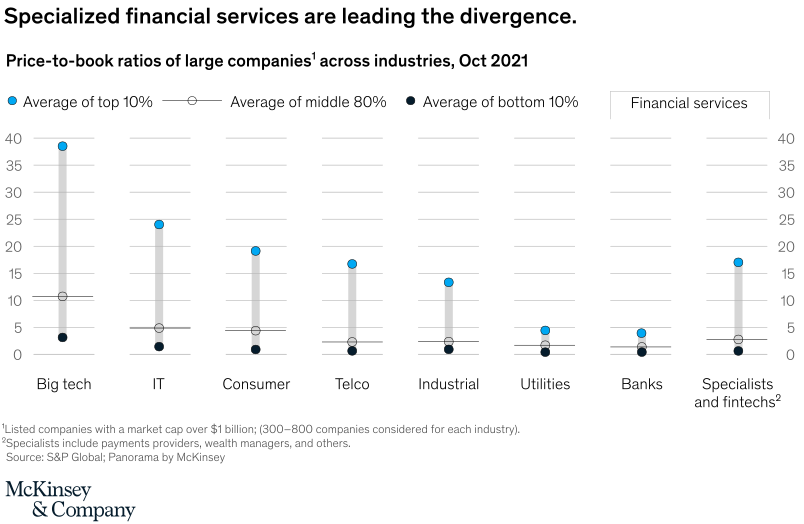
February 1, 2022 – In the new edition of McKinsey’s Global Annual Banking Review, we look at the industry’s great divergence. Traditional banks, which rely on balance sheet business, are valued similarly to utilities. Financial specialists (especially in payments) and fintechs, which are more focused on origination and sales, are valued more like tech companies in other industries. Read the report for more on the sources of divergence and a playbook for laggards to catch up.
To read the report, see “McKinsey’s Global Banking Annual Review,” December 1, 2021.
customizer here
Visual form
Dot-and-range comparison chart.
Layout / body structure
The chart is a single horizontal lineup of industries read left to right on a shared vertical valuation scale. A financial-services bracket sits above the last two categories, so the reader scans across all industries and then reads the banks-versus-specialists comparison as a focused subcomparison inside the same chart.
What is being compared
The chart compares price-to-book ratios for large companies across industries in October 2021. Within each industry it compares the average of the top 10 percent, the middle 80 percent, and the bottom 10 percent.
Measurement system
The vertical axis shows price-to-book ratios on a roughly 0-to-40 scale. Blue filled dots mark the top 10 percent, hollow circles mark the middle 80 percent, and dark filled dots mark the bottom 10 percent, with a pale vertical range linking the low and high points in each category.
Visible structure inside the graphic
Each industry column has three markers stacked vertically over its label: Big tech, IT, Consumer, Telco, Industrial, Utilities, Banks, and Specialists and fintechs. The tallest spread appears in big tech, while the two financial-services columns sit under their own callout box and show a sharp gap between banks and specialists.
Main takeaway from the visual
The page makes the divergence visible by showing banks valued much more like low-multiple utilities while specialists and fintechs sit materially higher. Financial services do not move as a single block here; the chart splits them into a lagging bank column and a much stronger specialist/fintech column.
Key standout values or extremes
Big tech has the highest top-decile marker at just under 40, IT sits near the mid-20s, and consumer is near 19. Inside financial services, specialists and fintechs reach the high teens at the top end, while banks sit only around 4 at the top and around 1 at the bottom.
Controls / sequence, when applicable
This is a static chart image with no in-chart controls to operate.
Companion media, when applicable
There is no separate companion audio or video; the chart image is the full visual on this page.