Source page: McKinsey & Company
Commentary
Filler up
Life Sciences
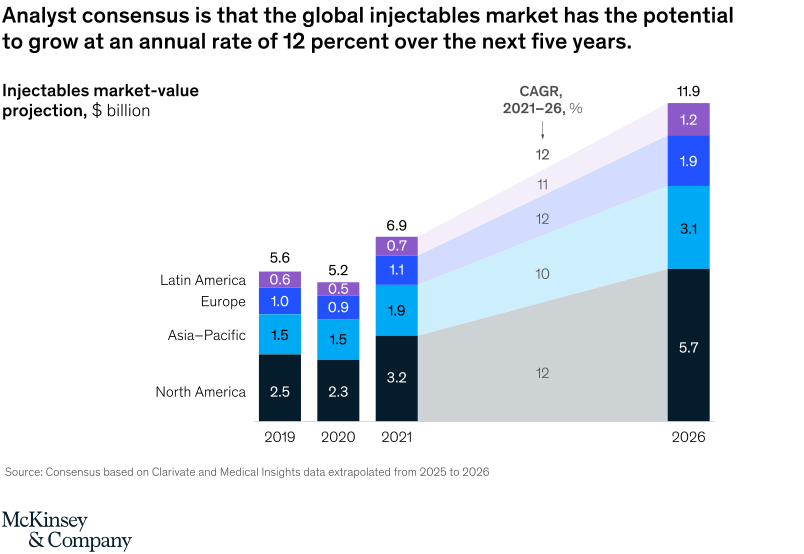
January 24, 2022 – Some people are showing no hesitation about getting a jab—of aesthetic injectables. Greater consumer spending power and an ever-expanding portfolio of fillers and biostimulators are giving the aesthetics market a boost, with growth expected at about 12 percent annually through 2026.
To read the article, see “From extreme to mainstream: The future of aesthetics injectables,” December 20, 2021.
customizer here
Visual form
Stacked column forecast chart with CAGR bands.
Layout / body structure
The chart places three historical stacked columns for 2019, 2020, and 2021 on the left and one larger projected 2026 column on the right. Colored growth bands bridge the 2021 stack to the 2026 stack, so the reader moves from the historical bars into the forward projection and then reads the CAGR labels inside each band.
What is being compared
The chart compares the injectables market value across four regions over time and into a five-year projection. It is comparing North America, Asia-Pacific, Europe, and Latin America within the total global injectables market.
Measurement system
The vertical values are market size in billions of dollars, with totals printed above each stacked column. The connector bands label CAGR for 2021 to 2026, and each regional segment is directly labeled within the stacks.
Visible structure inside the graphic
Each year is shown as a four-part stacked bar, with North America at the base and smaller regional segments stacked above it. The 2026 projection rises well above the earlier columns, and the sloped colored bands between 2021 and 2026 visually carry the regional growth rates forward.
Main takeaway from the visual
The chart presents the injectables market as a strong multi-region growth story rather than a flat mature category. The total stack expands sharply from 2021 to 2026, and every regional band tilts upward, which makes the 12 percent overall annual growth rate feel broad based rather than dependent on a single region.
Key standout values or extremes
The total market is labeled at 5.6 billion in 2019, 5.2 billion in 2020, 6.9 billion in 2021, and 11.9 billion in 2026. In 2026 the stack is labeled 5.7 for North America, 3.1 for Asia-Pacific, 1.9 for Europe, and 1.2 for Latin America, with CAGR labels clustered around 10 to 12 percent and the headline growth rate called out at 12 percent.
Controls / sequence, when applicable
This is a static chart image with no in-chart controls to operate.
Companion media, when applicable
There is no separate companion audio or video; the chart image is the full visual on this page.