Source page: McKinsey & Company
Commentary
Patently inferior?
Biotech | Start-ups | Europe
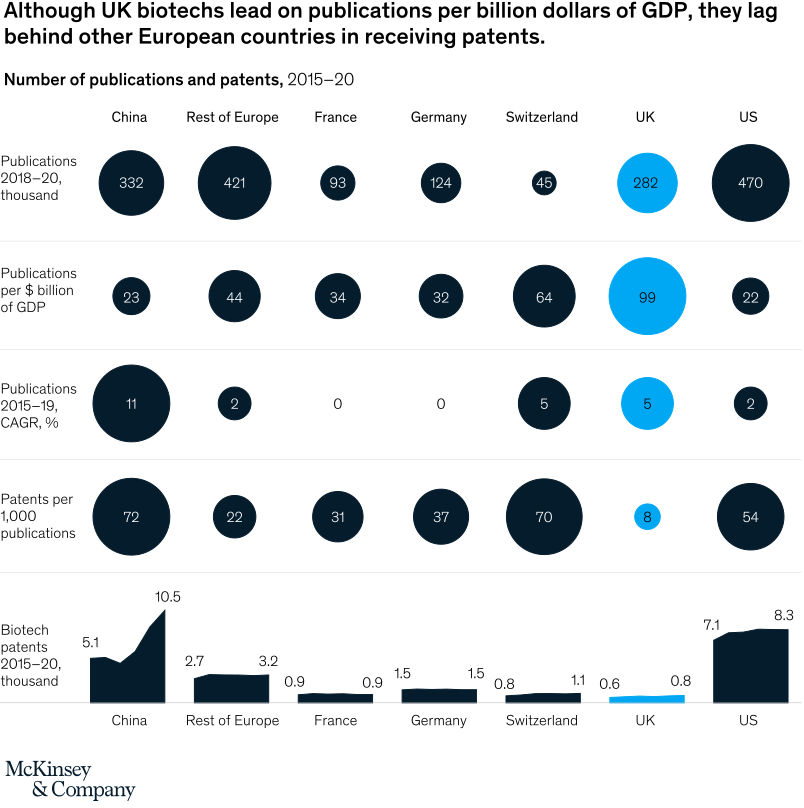
January 19, 2022 – The United Kingdom has always had a reputation for scientific excellence, with world-class universities and Nobel laureates by the dozen. Our Biotech Innovation Index finds the reputation is justified: the country leads its European peers in total life-sciences publications and leads the world in publications per billion dollars of GDP. One surprising gap: UK startups receive fewer patents than other European countries.
To read the article, see “The UK biotech sector: The path to global leadership,” December 3, 2021.
customizer here
Visual form
Multi-row bubble chart with a companion bar strip.
Layout / body structure
The chart is organized as four horizontal bubble rows comparing countries across publications, publications relative to GDP, publication growth, and patents per 1,000 publications, followed by a bottom strip of biotech-patent totals. Reader scans country by country across each row and then uses the bottom patent-total bars as a final anchor.
What is being compared
The chart compares biotech research output and patenting outcomes across China, the rest of Europe, France, Germany, Switzerland, the UK, and the United States. It sets publication scale, publication intensity, publication growth, patent efficiency, and total biotech-patent counts beside one another.
Measurement system
Bubble size and printed numbers carry the main quantitative load in the top four rows, while the bottom row uses small bars with values above them to show total biotech patents in thousands. Each row measures a different unit, so the labels inside the chart define whether the reader is tracking thousands of publications, publications per GDP, CAGR, or patents per 1,000 publications.
Visible structure inside the graphic
Each country gets one bubble per row, aligned in columns so the reader can compare the same country down the page. The UK column is highlighted in blue, which makes its contrast with Switzerland, the rest of Europe, China, and the US especially visible in the patent rows and in the bottom biotech-patent totals strip.
Main takeaway from the visual
The page shows that the UK performs strongly on publication intensity but underperforms on patents. The highlighted UK bubbles are large in publications per billion dollars of GDP but very small in patents per 1,000 publications and in total biotech-patent output, which makes the patent gap visually unmistakable.
Key standout values or extremes
The UK is labeled at 99 publications per $ billion of GDP, the highest figure in that row, but only 8 patents per 1,000 publications, far below Switzerland at 70, China at 72, Germany at 37, France at 31, the rest of Europe at 22, and the US at 54. In the bottom strip the UK sits at only 0.8 thousand biotech patents, versus 8.3 for the US and 10.5 for China.
Controls / sequence, when applicable
This is a static chart image with no in-chart controls to operate.
Companion media, when applicable
There is no separate companion audio or video; the chart image is the full visual on this page.