Source page: McKinsey & Company
Commentary
Holding back their whole selves
Diversity & Inclusion
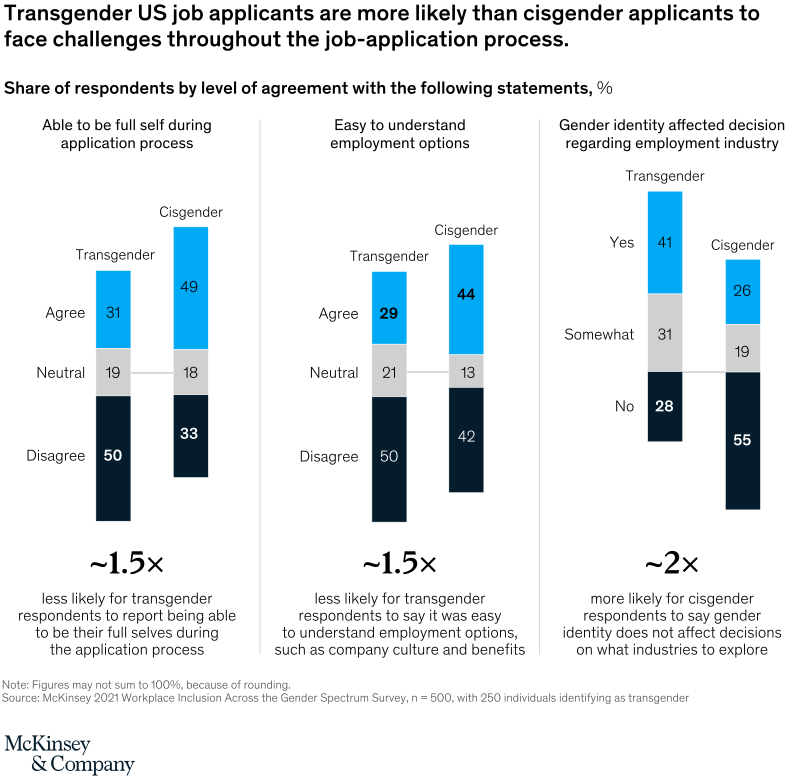
January 17, 2022 – In a culture that still largely views gender on binary terms, transgender people in America face unique challenges in the job-application process. Half of transgender respondents to a recent McKinsey survey indicated they couldn’t be their full selves when applying for jobs. Only 33 percent of cisgender applicants indicated the same.
To read the article, see “Being transgender at work,” November 10, 2021.
customizer here
Visual form
Three-panel stacked column comparison chart.
Layout / body structure
The chart is split into three vertical panels placed left to right, each with two stacked columns comparing transgender and cisgender respondents. Reader compares the paired columns within each panel first and then moves across the row from application authenticity to employment understanding to industry-choice impact.
What is being compared
The chart compares respondent agreement levels on three job-application experiences: being able to be their full self during the application process, finding employment options easy to understand, and the extent to which gender identity affected industry decisions. It compares transgender respondents with cisgender respondents in each panel.
Measurement system
Each column is stacked to 100 percent using three agreement levels, with the segments labeled directly inside the bars. In the first two panels the stacks are Agree, Neutral, and Disagree, while the third panel uses Yes, Somewhat, and No.
Visible structure inside the graphic
Every panel shows two tall stacked columns, one labeled Transgender and one Cisgender, with light, medium, and dark sections carrying the response split. The page also adds large summary callouts underneath the panels showing about 1.5 times lower odds in the first two comparisons and about 2 times higher odds in the third.
Main takeaway from the visual
The chart shows transgender applicants encountering more friction throughout the job-application process. Compared with cisgender respondents, they are less likely to say they can be their full selves, less likely to say employment options are easy to understand, and more likely to say gender identity affects industry decisions.
Key standout values or extremes
In the first panel, Agree is 31 percent for transgender respondents versus 49 percent for cisgender respondents, while Disagree is 50 versus 33 percent. In the second, Agree is 29 versus 44 percent. In the third, 41 percent of transgender respondents say gender identity affected industry choice, compared with 26 percent of cisgender respondents, while No is 28 versus 55 percent.
Controls / sequence, when applicable
This is a static chart image with no in-chart controls to operate.
Companion media, when applicable
There is no separate companion audio or video; the chart image is the full visual on this page.