Source page: McKinsey & Company
Commentary
Give me a break
Remote work | Work-life balance
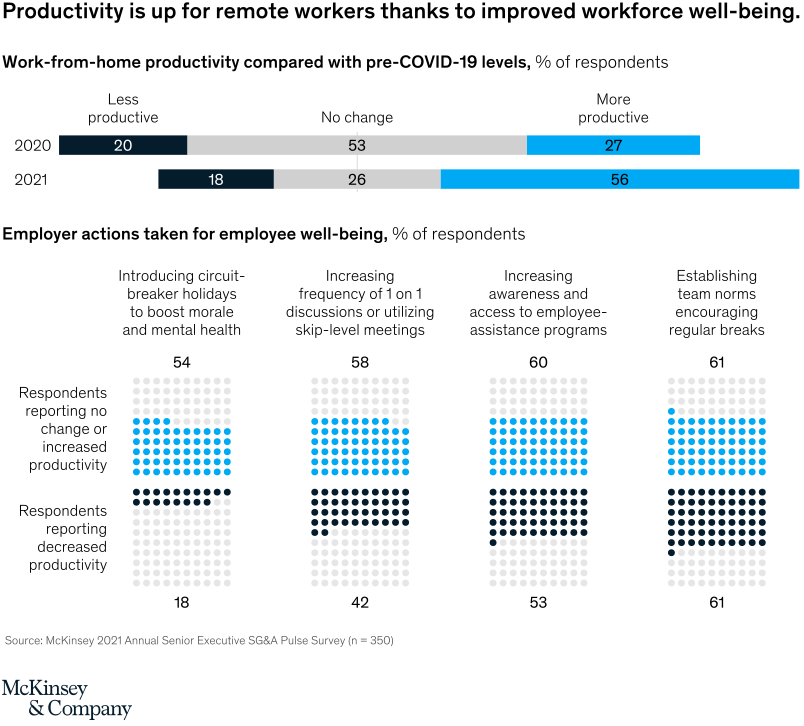
January 6, 2022 – Better output by working less? The concept may sound counterproductive, but more than half of employers that introduced “circuit breaker” holidays during the COVID-19 pandemic saw boosts in employee mental health and morale, according to our recent survey.
To read the article, see “Managing change: What lies behind G&A spend transformation,” December 6, 2021.
customizer here
Visual form
Mixed stacked-bar and dot-matrix comparison chart.
Layout / body structure
The chart has two distinct layers. The top layer is a two-row horizontal stacked-bar comparison between 2020 and 2021 productivity perceptions, and the lower layer is a four-column set of dot matrices showing employer well-being actions alongside reported productivity outcomes.
What is being compared
The visual compares work-from-home productivity relative to pre-COVID-19 levels across two years and then compares several employer well-being actions against reported productivity outcomes. It is linking perceived productivity change with specific workforce-support practices.
Measurement system
The top bars are measured as percent of respondents split into less productive, no change, and more productive. The lower dot matrices use 100-dot arrays with percentages printed above and below each action, separating respondents reporting no change or increased productivity from those reporting decreased productivity.
Visible structure inside the graphic
At the top, the 2020 and 2021 bars are split into dark, gray, and bright-blue segments labeled 20, 53, and 27 for 2020 and 18, 26, and 56 for 2021. Beneath that, four columns show employer actions such as circuit-breaker holidays, more frequent one-on-one discussions, increased awareness of employee-assistance programs, and team norms encouraging regular breaks, each paired with two dot grids and percentage labels.
Main takeaway from the visual
The page shows a clear shift toward higher reported productivity in 2021 and ties that improvement to well-being actions taken by employers. The much larger blue share in the 2021 productivity bar and the stronger upper percentages in the lower action panels make the productivity gains look connected to support and recovery rather than simple endurance.
Key standout values or extremes
The share reporting themselves as more productive rises from 27 percent in 2020 to 56 percent in 2021, while the no-change group falls from 53 percent to 26 percent. In the lower panels, regular-break norms show 61 percent reporting no change or increased productivity and 61 percent reporting decreased productivity is displayed as a contrast point, while employee-assistance awareness shows 60 versus 53 and one-on-one discussions show 58 versus 42.
Controls / sequence, when applicable
This is a static chart image with no in-chart controls to operate.
Companion media, when applicable
There is no separate companion audio or video; the chart image is the full visual on this page.