Source page: McKinsey & Company
Commentary
Office space
Future of Work
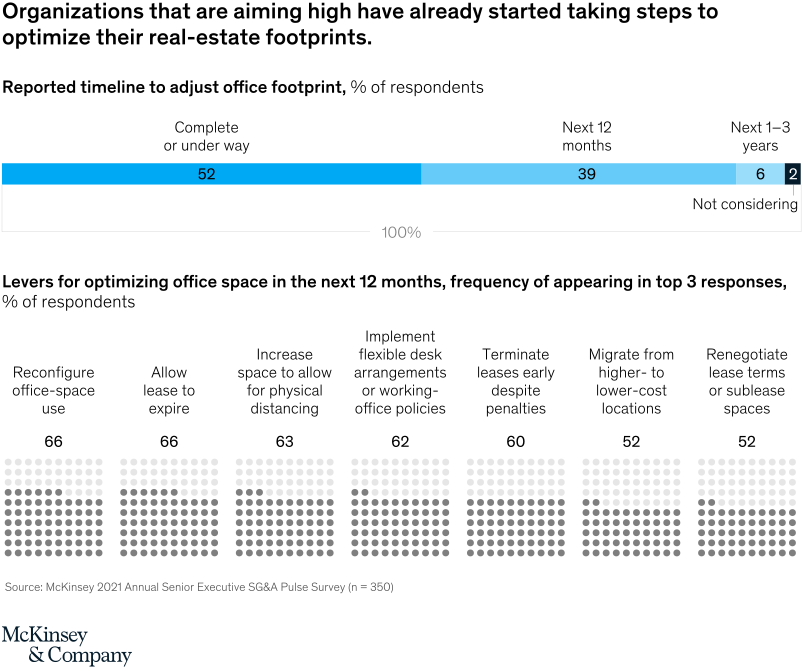
January 3, 2022 – The uptick in remote and hybrid work is causing organizations to rethink how they use their office space. More than 50 percent of respondents to our recent survey noted they are optimizing their real-estate portfolios or have already done so. At the top of their list are flexible desk arrangements and early lease termination.
To read the article, see “Managing change: What lies behind G&A spend transformation,” December 6, 2021.
customizer here
Visual form
Mixed stacked-bar and dot-matrix summary chart.
Layout / body structure
The chart has two layers. The top layer is a single horizontal stacked bar showing the timeline for adjusting office footprint, and the bottom layer is a row of dot-matrix tiles that rank the most common office-space levers expected in the next 12 months.
What is being compared
The visual compares how far along organizations are in changing their office footprint and which office-space optimization levers they expect to use most often. It compares timing categories in the top bar and then compares seven specific levers in the lower grid.
Measurement system
The top bar is measured as percent of respondents and split into complete or under way, next 12 months, next 1 to 3 years, and not considering. The bottom section uses 100-dot arrays and printed percentages to show how often each lever appeared in respondents’ top three answers.
Visible structure inside the graphic
The upper stacked bar is dominated by a long 52-percent segment labeled complete or under way, followed by 39 percent for the next 12 months, 6 percent for the next 1 to 3 years, and a thin 2-percent sliver for not considering. Below that, seven dot matrices show reconfigure office-space use, allow leases to expire, increase space for physical distancing, implement flexible desk arrangements, terminate leases early despite penalties, migrate from higher- to lower-cost locations, and renegotiate lease terms or sublease spaces.
Main takeaway from the visual
Organizations aiming high on cost and real-estate optimization have already moved beyond planning and into action. The top bar shows that the overwhelming majority are already under way or moving within a year, and the lower dot matrices show a broad set of levers being used rather than a single dominant tactic.
Key standout values or extremes
At the timeline level, 52 percent are complete or under way and another 39 percent expect change in the next 12 months, leaving only 2 percent not considering it. In the levers section, reconfigure office-space use and allow leases to expire both lead at 66 percent, followed by 63 percent for creating space for physical distancing, 62 percent for flexible desk arrangements, 60 percent for terminating leases early, and 52 percent each for migrating to lower-cost locations and renegotiating or subleasing.
Controls / sequence, when applicable
This is a static chart image with no in-chart controls to operate.
Companion media, when applicable
There is no separate companion audio or video; the chart image is the full visual on this page.