Source page: McKinsey & Company
Commentary
Hail yes to more mobility
Asia-Pacific | Automotive | Mobility
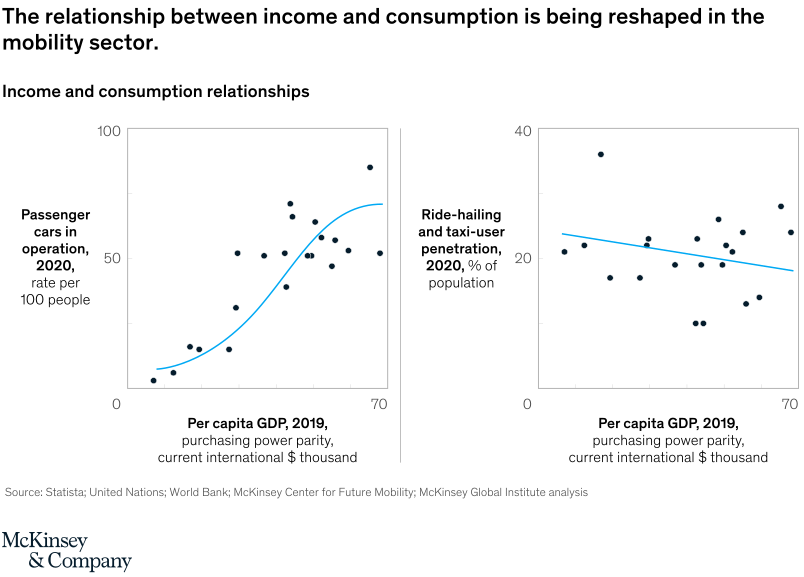
December 22, 2021 – Ride-hailing services are upending the mobility sector in Asia. While passenger-car sales traditionally follow an S-curve based on income, ride hailing remains relatively inexpensive, allowing more consumers in this region access to mobility through private vehicles.
To read the article, see “Asia’s consumers on the move: The future of mobility,” October 29, 2021.
customizer here
Visual form
Two-panel scatter plot with fitted trend lines.
Layout / body structure
The chart is split into two side-by-side scatter plots sharing the same horizontal income scale. Reader scans the left panel first for passenger-car ownership and then the right panel for ride-hailing and taxi-user penetration, comparing how the fitted blue line changes across the two relationships.
What is being compared
The chart compares per capita GDP with two different mobility outcomes: passenger cars in operation per 100 people and ride-hailing or taxi-user penetration as a share of population. It is an income-versus-consumption comparison shown in two mobility categories at once.
Measurement system
Both panels use per capita GDP in 2019, at purchasing power parity in current international dollars thousands, on the x-axis. The left y-axis measures passenger cars per 100 people on a 0-to-100 scale, while the right y-axis measures ride-hailing and taxi-user penetration on a 0-to-40 scale.
Visible structure inside the graphic
Each panel contains a cloud of black dots representing country observations and a blue fitted line summarizing the relationship. The left line curves upward in an S-like pattern as incomes rise, while the right line slopes gently downward, showing a different relationship between income and access-based mobility.
Main takeaway from the visual
The chart shows that private-car ownership rises strongly with income, but ride-hailing and taxi use does not follow the same upward path. As incomes climb, passenger-car ownership accelerates, while ride-hailing penetration stays flatter and even tilts downward in the fitted line.
Key standout values or extremes
In the left panel, the fitted line starts near single-digit car ownership at low incomes and climbs toward roughly 70 cars per 100 people near the top of the income range. In the right panel, most observations cluster around 15 to 25 percent user penetration, with the fitted line slipping from just above 20 percent at lower incomes to the high teens at the upper end.
Controls / sequence, when applicable
This is a static chart image with no in-chart controls to operate.
Companion media, when applicable
There is no separate companion audio or video; the chart image is the full visual on this page.