Source page: McKinsey & Company
Commentary
C-suite inaccessible for many transgender workers
Diversity & Inclusion
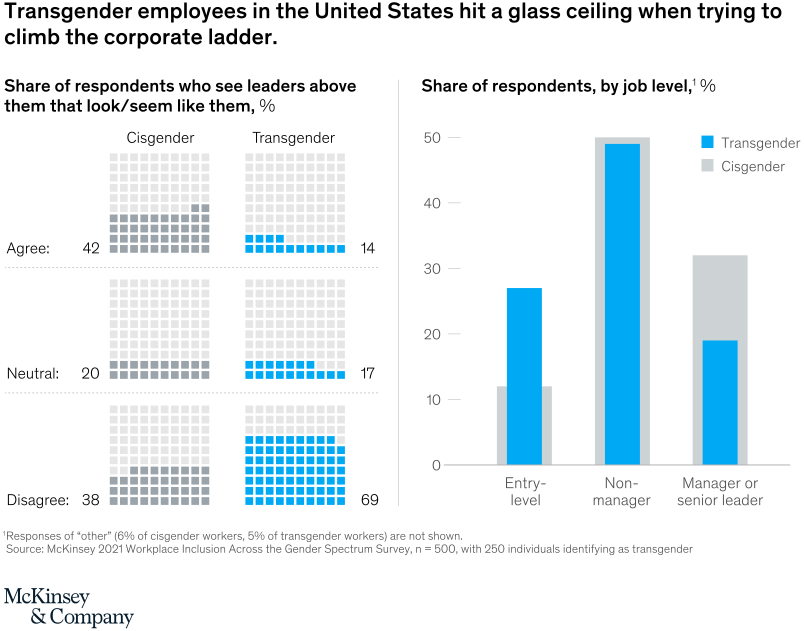
December 20, 2021 – Transgender employees in corporate America see few opportunities for upward advancement, according to results of a recent McKinsey survey. Nearly 50 percent of transgender respondents indicated they were in nonmanagement positions, while only 19 percent occupied senior roles, compared with more than 30 percent of cisgender respondents in management.
To read the article, see “Being transgender at work,” November 10, 2021.
customizer here
Visual form
Split chart combining waffle charts and grouped bar charts.
Layout / body structure
The page is arranged in two columns. The left column stacks three rows of 100-square grids for agree, neutral, and disagree, each row pairing cisgender and transgender responses, while the right column places a three-category grouped bar chart for entry-level, non-manager, and manager or senior leader roles.
What is being compared
The chart compares whether respondents see leaders above them who look or seem like them and then compares where respondents sit in the job ladder by identity group. It is a representation-and-seniority comparison between cisgender and transgender employees.
Measurement system
Both sides are measured in percent of respondents. The waffle grids show percentage shares through filled squares and printed labels, and the bar chart uses a vertical percentage scale with blue bars for transgender respondents and gray bars for cisgender respondents.
Visible structure inside the graphic
On the left, each row contains two 10-by-10 grids with the filled portion concentrated at the bottom of the matrix and labeled 42 versus 14 for agree, 20 versus 17 for neutral, and 38 versus 69 for disagree. On the right, three paired bars compare the share of respondents at entry level, non-manager, and manager or senior leader levels, with the transgender bar highest at entry level and the cisgender bar highest at the senior end.
Main takeaway from the visual
Transgender respondents are much less likely to say that leaders above them look or seem like them, and they are more concentrated lower in the corporate ladder. The chart makes the glass-ceiling claim visible by pairing a much larger disagreement share on the left with a much smaller manager-or-senior-leader share on the right.
Key standout values or extremes
The largest perception gap is in disagreement, where 69 percent of transgender respondents versus 38 percent of cisgender respondents say leaders above them do not look or seem like them, while agreement flips to 14 percent versus 42 percent. On the job-level side, transgender respondents are about 27 percent entry-level versus 12 percent for cisgender respondents, roughly 49 versus 50 percent at non-manager, and about 19 versus 32 percent at manager or senior leader.
Controls / sequence, when applicable
This is a static chart image with no in-chart controls to operate.
Companion media, when applicable
There is no separate companion audio or video; the chart image is the full visual on this page.