Source page: McKinsey & Company
Commentary
Transgender people twice as likely to be unemployed
Diversity & Inclusion
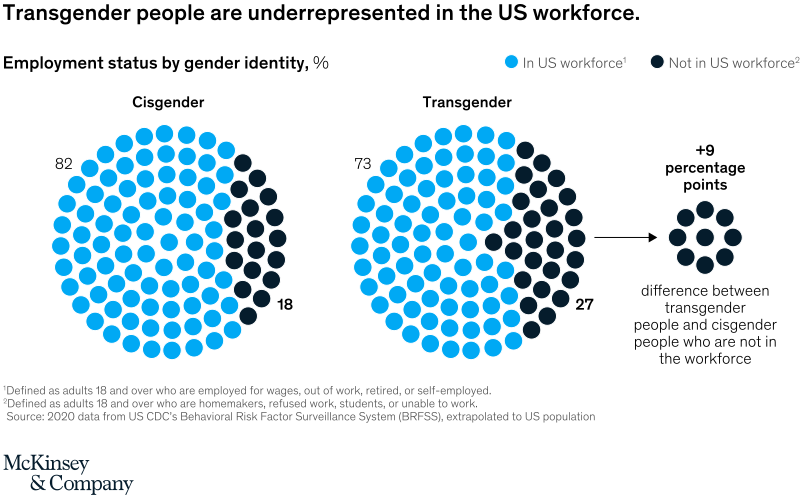
December 15, 2021 – Transgender people continue to face stigma and discrimination, despite gains in public visibility. Those struggles carry over to the workforce, where transgender people overall are underrepresented, according to our recent survey: nearly 30 percent of transgender people in the United States are not in the workforce and are twice as likely as the cisgender population to be unemployed.
To read the article, see “Being transgender at work,” November 10, 2021.
customizer here
Visual form
Side-by-side dot-matrix comparison chart.
Layout / body structure
The chart places two large 100-dot arrays side by side, one for cisgender respondents and one for transgender respondents, and then adds a small callout cluster on the far right to summarize the gap. Reader compares the filled portions of the two circular grids first and then uses the arrow and right-hand callout to read the difference in people outside the workforce.
What is being compared
The chart compares employment status by gender identity. It contrasts the share of cisgender and transgender people who are in the US workforce versus not in the US workforce.
Measurement system
The measurement is percent share. Each circular dot array represents 100 percent of respondents, with blue dots marking people in the workforce and dark dots marking people not in the workforce, and the small callout on the right expresses the gap as percentage points.
Visible structure inside the graphic
The left circle shows an 82-to-18 split for cisgender respondents, and the right circle shows a 73-to-27 split for transgender respondents. An arrow points from the transgender chart to a smaller nine-dot cluster labeled as a 9 percentage point difference between transgender and cisgender people who are not in the workforce.
Main takeaway from the visual
Transgender people are visibly less represented in the workforce than cisgender people. The larger dark segment in the transgender circle and the explicit right-hand gap marker make the employment disparity read as both directionally clear and numerically meaningful.
Key standout values or extremes
Cisgender respondents are shown at 82 percent in the workforce and 18 percent not in the workforce, while transgender respondents are shown at 73 percent in the workforce and 27 percent not in the workforce. The chart highlights the resulting 9 percentage point difference in people outside the workforce.
Controls / sequence, when applicable
This is a static chart image with no in-chart controls to operate.
Companion media, when applicable
There is no separate companion audio or video; the chart image is the full visual on this page.