Source page: McKinsey & Company
Commentary
Murphy’s Law: Pharma edition
Pharmaceuticals & Medical Products | Risk
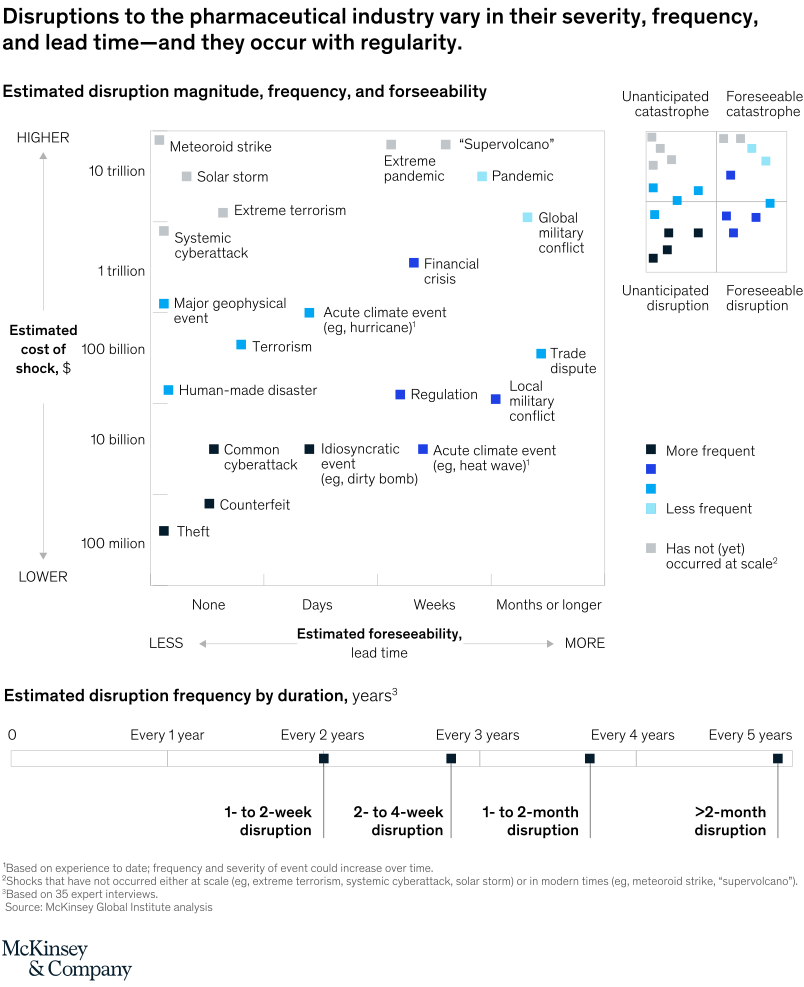
December 10, 2021 – In time, whatever can go wrong, will. That’s the surprising finding of our research on shocks to the pharmaceutical business system. Companies can expect mild disruptions every couple of years, and major breaks twice a decade.
To read the article, see “Four ways pharma companies can make their supply chains more resilient,” September 23, 2021.
customizer here
Visual form
Two-part disruption risk map.
Layout / body structure
The chart has a large upper scatter-style risk map and a separate lower duration-frequency strip. Reader first locates labeled disruption types in the main grid using cost on the vertical axis and foreseeability on the horizontal axis, then moves down to the lower strip to see how often disruptions of different durations tend to occur.
What is being compared
The chart compares pharmaceutical-industry disruptions by estimated cost, estimated foreseeability lead time, and frequency. It contrasts rare catastrophic events such as meteoroid strikes, supervolcanoes, pandemics, and global conflict with more frequent but lower-cost disruptions such as theft, counterfeit activity, cyberattacks, and trade disputes.
Measurement system
The upper vertical axis measures estimated cost of shock in dollars on a scale running from hundreds of millions up to trillions, while the upper horizontal axis measures foreseeability from none to months or longer. Color indicates how frequent or infrequent each disruption type is, and the lower strip converts disruption duration into an estimated recurrence pattern from roughly every year to every five years.
Visible structure inside the graphic
The main panel is filled with labeled square markers placed across the cost-foreseeability field, plus an inset legend that explains the frequency coloring and whether a disruption has occurred at scale. The lower panel then adds four grouped duration buckets from one to two weeks through more than two months, each aligned to a timeline that marks how often disruptions of that length are expected to happen.
Main takeaway from the visual
Pharma faces a layered risk profile in which smaller operational disruptions happen more frequently, while the most catastrophic shocks are rarer but still real and potentially more foreseeable than purely sudden events. The page makes that visible by pushing the biggest-cost scenarios into the upper portion of the map while keeping the most common disruptions clustered lower down and farther left.
Key standout values or extremes
The highest-cost points are meteoroid strike and supervolcano above the 10-trillion range, with pandemic and global military conflict also plotted in the trillion-dollar zone. At the other end, theft and counterfeit sit near the lowest-cost band with little to no lead time, while the lower strip shows one- to two-week disruptions occurring about every year and disruptions longer than two months occurring closer to every five years.
Controls / sequence, when applicable
This is a static chart image with no in-chart controls to operate.
Companion media, when applicable
There is no separate companion audio or video; the chart image is the full visual on this page.