Source page: McKinsey & Company
Commentary
Who crashed banking’s party?
Banking
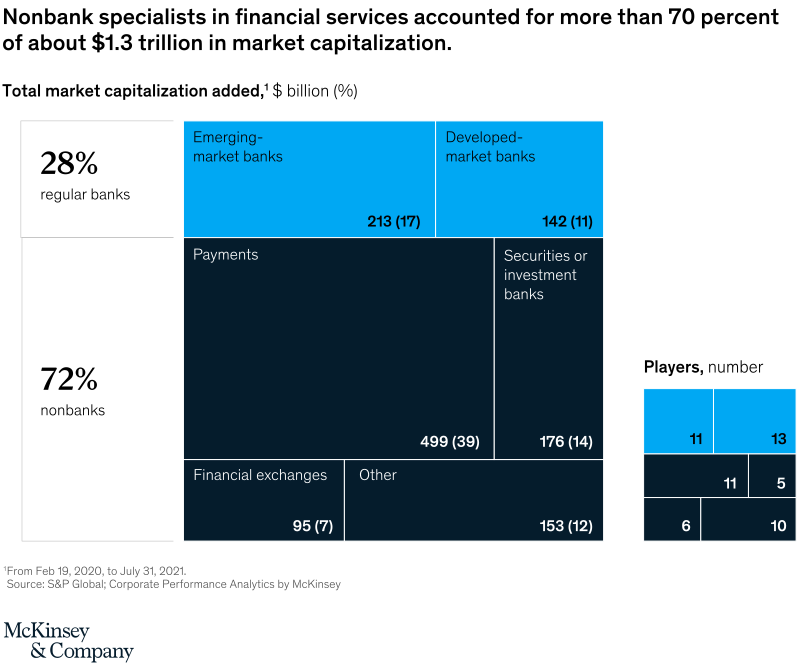
December 9, 2021 – In financial services, outperformers have gained $1.3 trillion in market cap since March 2020. But 70 percent of that has gone to nonbanks. A group of 32 institutions, dominated by payments firms, exchanges, and securities houses, has captured the fancy of investors.
To read the article, see “Capital markets’ message to financial institutions: Differentiate or perish,” September 28, 2021.
customizer here
Visual form
Treemap comparison chart with side summaries.
Layout / body structure
The chart starts with a tall left-hand split between regular banks and nonbanks, then moves into a larger treemap in the center that breaks market-capitalization gains into business groups. A smaller treemap on the right summarizes player counts, so the reader first sees where value accrued and then checks how many players sit in each segment.
What is being compared
The chart compares which types of financial-services players added market capitalization. It contrasts regular banks with nonbank specialists and then breaks those totals into emerging-market banks, developed-market banks, payments, securities or investment banks, financial exchanges, and other players.
Measurement system
The main treemap measures total market capitalization added in billions of dollars and as a percentage of the overall about 1.3 trillion dollars. The right-side inset switches units and measures the number of players in each segment.
Visible structure inside the graphic
On the left, a narrow panel shows 28 percent regular banks versus 72 percent nonbanks. In the center, the largest rectangle is payments at 499 billion dollars and 39 percent, with other dark nonbank blocks for securities or investment banks at 176 and 14 percent, financial exchanges at 95 and 7 percent, and other at 153 and 12 percent, while the blue bank blocks across the top show 213 and 17 percent for emerging-market banks and 142 and 11 percent for developed-market banks.
Main takeaway from the visual
Nonbank specialists captured most of the value created in the period, with payments alone dwarfing any individual banking segment. The treemap makes that shift visible by giving most of the central area to dark nonbank rectangles and reserving a much thinner slice of the page for the bank categories.
Key standout values or extremes
The headline split is 72 percent for nonbanks versus 28 percent for regular banks. Payments is the biggest single segment at 499 billion dollars and 39 percent, while the two bank segments together add 213 billion and 142 billion dollars, and the player-count inset shows small segment counts ranging from 5 up to 13 firms.
Controls / sequence, when applicable
This is a static chart image with no in-chart controls to operate.
Companion media, when applicable
There is no separate companion audio or video; the chart image is the full visual on this page.