Source page: McKinsey & Company
Commentary
Semiconductors bring back the sizzle
Semiconductors | Supply Chain Management
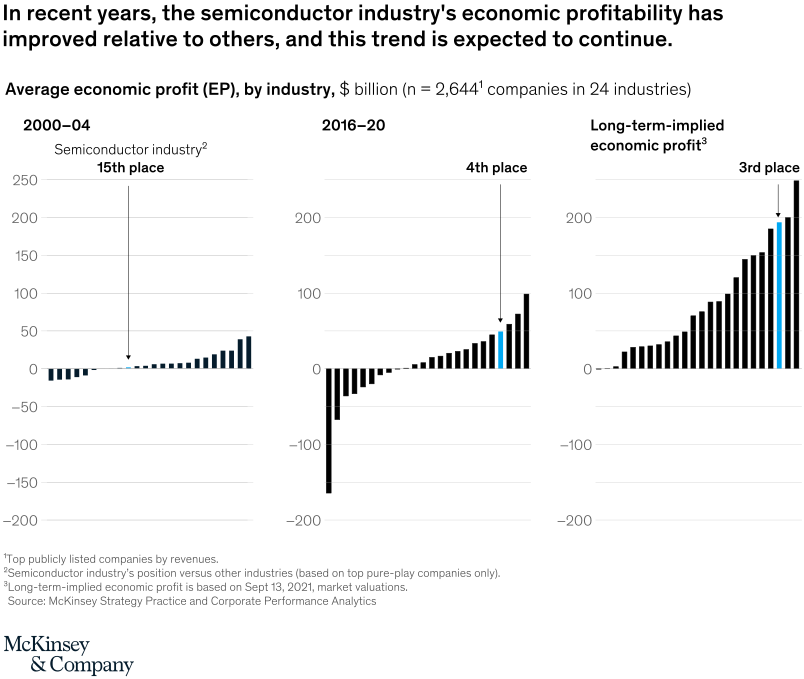
December 2, 2021 – The semiconductor sector’s profits are climbing, both absolutely and relative to other industries, and show no signs of slowing. The sector saw aggregate profits escalate from $3.5 billion in 2000–04 to $49.3 billion 2016–20. In future, we estimate that semiconductors could be the world’s third-most profitable industry.
To read the article, see “Value creation: How can the semiconductor industry keep outperforming?,” October 15, 2021.
customizer here
Visual form
Three-panel ranked bar chart.
Layout / body structure
The chart is arranged as three vertical bar-rank panels placed side by side for 2000 to 2004, 2016 to 2020, and long-term implied economic profit. Reader compares where the semiconductor industry’s highlighted blue bar sits inside each ranked field as the panels move from past to present to forward-looking view.
What is being compared
The chart compares average economic profit across 24 industries over two historical periods and one long-term implied ranking. It specifically tracks how the semiconductor industry’s position changes relative to the rest of the industry pack.
Measurement system
The vertical axis is measured in billions of dollars of average economic profit, with negative values below zero and positive values above it. Ranking is also encoded directly in the panel labels, which mark semiconductors as 15th place in 2000 to 2004, 4th place in 2016 to 2020, and 3rd place in the long-term implied panel.
Visible structure inside the graphic
Each panel contains a full lineup of narrow black bars sorted from weakest to strongest, with the semiconductor bar highlighted in blue and annotated by an arrow. The first panel shows the blue bar close to the middle of the field, the second panel moves it near the top cluster, and the third panel places it just below the very top of the ranked distribution.
Main takeaway from the visual
The semiconductor industry’s profitability has moved sharply upward relative to other industries and is expected to remain near the top. The visual makes that progression explicit by moving the blue highlight from the middle of the rankings into the upper tier and then into the top three.
Key standout values or extremes
The clearest visible anchors are the ranking labels: 15th place in 2000 to 2004, 4th place in 2016 to 2020, and 3rd place in the long-term implied view. In the last panel, the highlighted bar sits near the 200-billion-dollar level, well above the semiconductor bar in the first panel and distinctly below only the very top bars.
Controls / sequence, when applicable
This is a static chart image with no in-chart controls to operate.
Companion media, when applicable
There is no separate companion audio or video; the chart image is the full visual on this page.