Source page: McKinsey & Company
Commentary
Women see broken rungs on the asset-management ladder
Diversity & Inclusion | Financial services
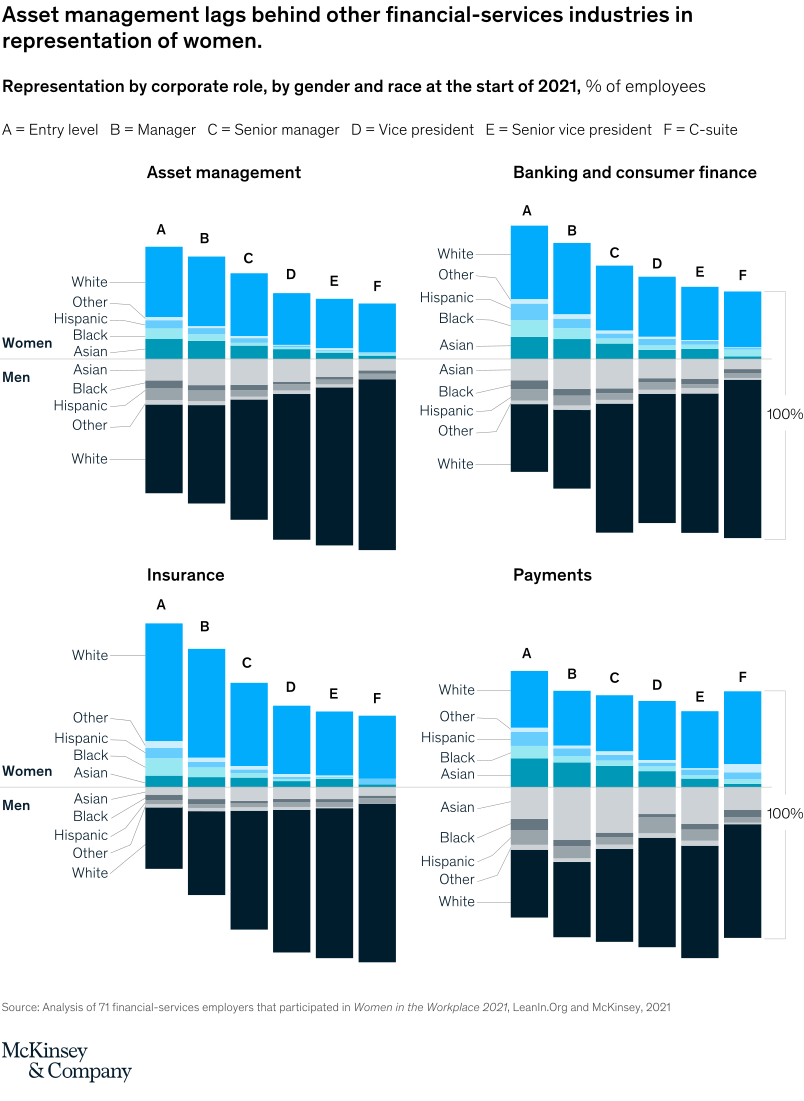
November 30, 2021 – Women have a tough time getting a foothold on the corporate ladder in financial services overall but particularly in the asset-management sector. There, the representation of women—and especially women of color—declines at every position after entry level and has the lowest amount of representation in the C-suite.
To read the article, see “Closing the gender and race gaps in North American financial services,” October 21, 2021.
customizer here
Visual form
Four-panel workforce composition ladder chart.
Layout / body structure
The chart is arranged as a two-by-two grid for asset management, banking and consumer finance, insurance, and payments. Within each panel, six vertical columns labeled A through F run from entry level to C-suite, so the reader compares the gender-and-race mix down the role ladder inside each industry and then compares those ladders across industries.
What is being compared
The chart compares representation by corporate role, gender, and race at the start of 2021 across four financial-services industries. It shows how the workforce mix changes from entry level through manager, senior manager, vice president, senior vice president, and C-suite positions.
Measurement system
Each column is a 100 percent composition bar. The bars are split above and below a central divider between women and men, and color segments inside those halves identify White, Asian, Black, Hispanic, and Other groups, so the reader is tracking share of employees rather than raw counts.
Visible structure inside the graphic
Every panel contains six stacked columns, one for each corporate level, with the women portion occupying the upper half of the bars and the men portion the lower half. Asset management’s columns narrow more aggressively on the women side as roles advance, while the other industry panels keep thicker upper segments deeper into the ladder, especially at entry and middle-management levels.
Main takeaway from the visual
Asset management loses women’s representation faster up the ladder than the other financial-services industries in the comparison. The broken-rungs point is visible because the upper, women-coded sections shrink more noticeably from A through F in asset management than they do in banking, insurance, or payments.
Key standout values or extremes
The chart does not print individual percentages inside the bars, so the main visible extremes are positional rather than numeric. The strongest visual contrast is at the senior levels, where asset management shows the thinnest women share in the vice president, senior vice president, and C-suite columns compared with the other three industry panels.
Controls / sequence, when applicable
This is a static chart image with no in-chart controls to operate.
Companion media, when applicable
There is no separate companion audio or video; the chart image is the full visual on this page.