Source page: McKinsey & Company
Commentary
Powering down emissions
North America | Decarbonization | COP-26
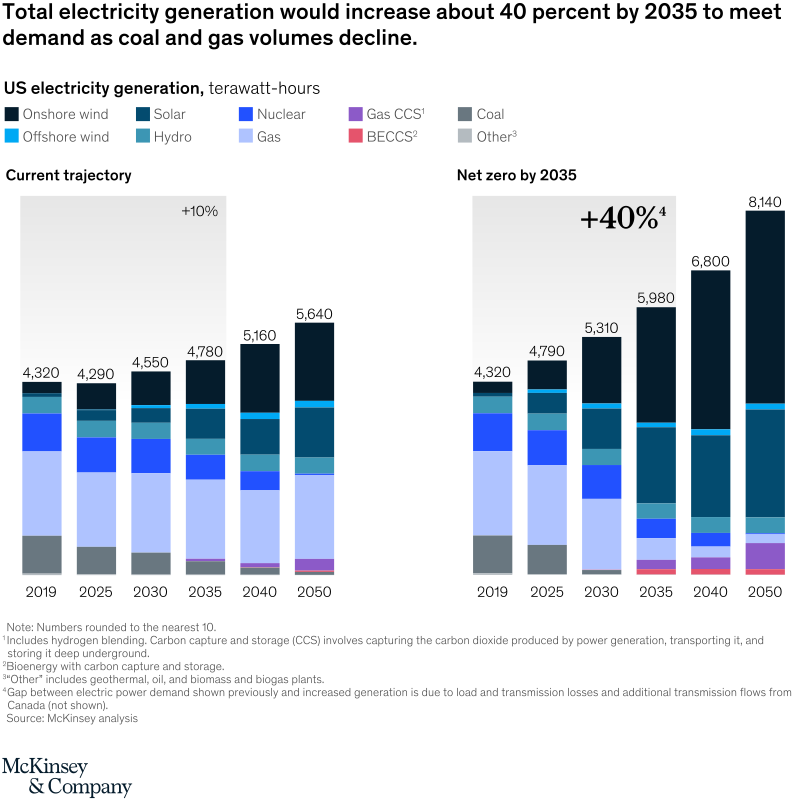
November 18, 2021 – If the US is to meet its stated goal of decarbonizing the power sector, two things would have to happen. The mix of fuels used in power plants would need to shift away from coal and gas and toward renewables. And the sector would have to produce much more power, as other industries such as transportation go electric.
To read the article, see “Net zero by 2035: A pathway to rapidly decarbonize the US power system,” October 14, 2021.
customizer here
Visual form
Two-panel stacked bar chart.
Layout / body structure
The chart is split into two side-by-side scenarios, current trajectory on the left and net zero by 2035 on the right. Reader compares the stacked generation mix across the same sequence of years in both panels, watching how the bars change in total height and in the mix of coal, gas, nuclear, hydro, solar, wind, and other technologies.
What is being compared
The chart compares US electricity generation under the current trajectory versus a net-zero-by-2035 pathway. It is comparing both total electricity demand over time and the composition of generation sources needed to meet that demand.
Measurement system
The bars are measured in terawatt-hours, with totals printed above each stacked column. The left scenario highlights about plus 10 percent growth by 2035, while the right scenario highlights about plus 40 percent growth by 2035, and the legend identifies the color-coded generation sources.
Visible structure inside the graphic
Each panel contains stacked bars for 2019, 2025, 2030, 2035, 2040, and 2050. In the current-trajectory panel, gas and fossil components remain substantial while the total rises from 4,320 to 5,640 terawatt-hours; in the net-zero panel, dark wind and solar segments grow dramatically and the total climbs from 4,320 to 8,140 by 2050, while coal and gas shrink visibly.
Main takeaway from the visual
Reaching a net-zero power system requires much more electricity generation and a much faster shift toward low-carbon sources than the current trajectory implies. The right panel is both taller and cleaner-looking by the end of the horizon, with renewable-heavy stacks replacing the fossil-heavy mix seen on the left.
Key standout values or extremes
Under the current trajectory, the total rises from 4,320 in 2019 to 4,780 in 2035 and 5,640 in 2050. Under net zero by 2035, the totals reach 4,790 in 2025, 5,310 in 2030, 5,980 in 2035, 6,800 in 2040, and 8,140 in 2050, making the gap between scenarios most visible in the later years.
Controls / sequence, when applicable
This is a static chart image with no in-chart controls to operate.
Companion media, when applicable
There is no separate companion audio or video; the chart image is the full visual on this page.