Source page: McKinsey & Company
Commentary
Make way for the golden age of transport infrastructure
Infrastructure
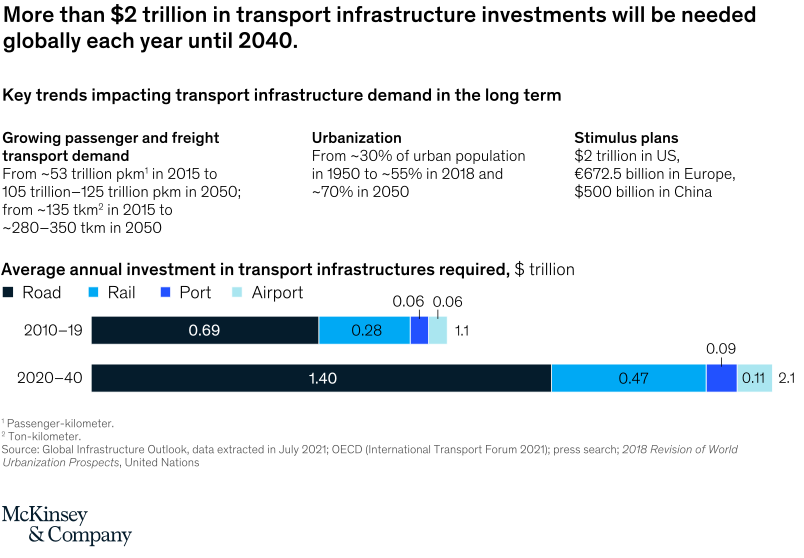
November 10, 2021 – Significant transport infrastructure spending is on the horizon. From now until 2040, approximately $2 trillion in transport infrastructure investments would be needed every year, with large investments projected for road improvements.
To read the article, see “Built to last: Making sustainability a priority in transport infrastructure,” October 1, 2021.
customizer here
Visual form
Two-row stacked horizontal bar chart with headline callouts.
Layout / body structure
The chart starts with three short text callouts across the top for passenger and freight growth, urbanization, and stimulus plans, then places two stacked horizontal bars underneath for 2010 to 2019 and 2020 to 2040. Reader takes in the macro demand drivers first and then compares how the investment mix and total scale change between the two time periods.
What is being compared
The chart compares average annual transport-infrastructure investment needs across two periods and across four transport modes. It contrasts road, rail, port, and airport spending in 2010 to 2019 versus the much larger required investment profile in 2020 to 2040.
Measurement system
The bars are measured in trillions of dollars per year, with segment values printed inside or above the bar components and the total printed at the end of each row. The supporting callouts also use trillions of passenger-kilometers, ton-kilometers, and urban-population shares to explain why demand rises.
Visible structure inside the graphic
The first bar totals 1.1 trillion and is dominated by roads at 0.69, followed by rail at 0.28 and small port and airport segments at 0.06 each. The second bar grows to 2.1 trillion, with roads expanding to 1.40, rail to 0.47, port to 0.09, and airport to 0.11, so the later-period bar is both much longer overall and larger in every segment.
Main takeaway from the visual
Transport infrastructure enters a much bigger investment era, with demand roughly doubling from the earlier period to the longer-term requirement through 2040. Roads remain the largest spending category, but the chart also shows meaningful growth in rail, ports, and airports rather than a one-mode story.
Key standout values or extremes
The total rises from 1.1 trillion dollars per year in 2010 to 2019 to 2.1 trillion in 2020 to 2040. Roads jump from 0.69 to 1.40 trillion, rail from 0.28 to 0.47, and the smallest visible segment remains ports, which still increases from 0.06 to 0.09 trillion.
Controls / sequence, when applicable
This is a static chart image with no in-chart controls to operate.
Companion media, when applicable
There is no separate companion audio or video; the chart image is the full visual on this page.