Source page: McKinsey & Company
Commentary
Turbulence in the global payments pool
Financial services | Payments | Asia-Pacific
November 8, 2021 – Global payment revenues have been on a downward trajectory as the result of the pandemic. Even the Asia–Pacific region, which normally outpaces other areas in revenue growth, saw a contraction of 6 percent in 2020. Still, this year’s global payments revenues could be closer to 2019 figures, setting a foundation for a broader recovery.
To read the article, see “Global payments 2021: Transformation amid turbulent undercurrents,” October 7, 2021.
customizer here
Visual form
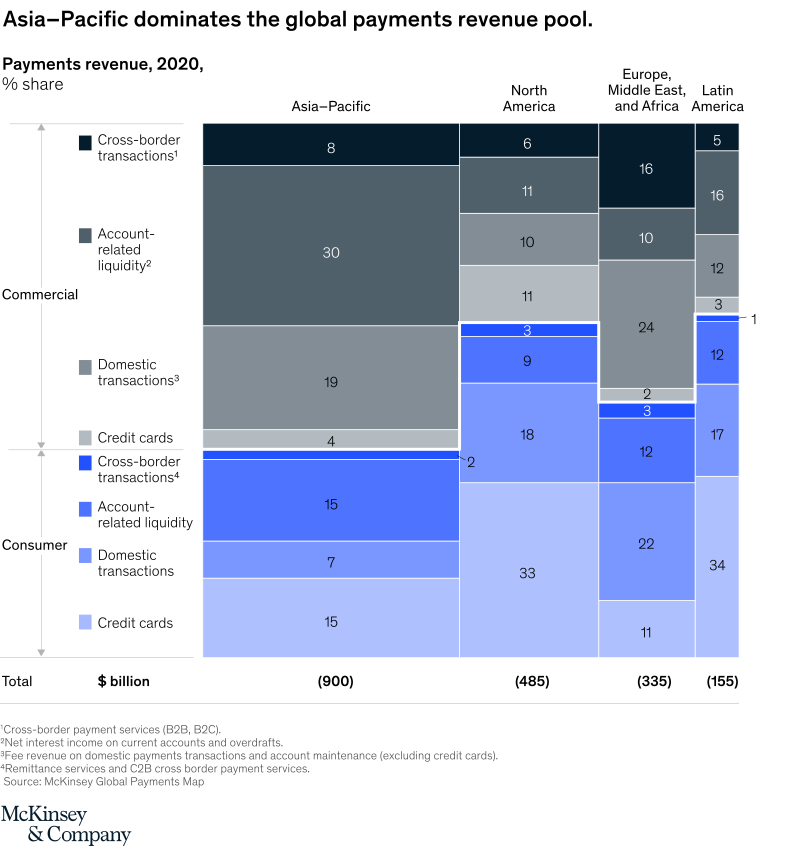
Regional stacked-rectangle composition chart.
Layout / body structure
The chart is organized into four vertical regional columns for Asia-Pacific, North America, Europe-Middle East-and-Africa, and Latin America. Inside each column, stacked blocks split the payments pool into commercial and consumer segments and then into narrower revenue categories, so the reader compares both total regional size and internal mix across the four regions.
What is being compared
The chart compares the global payments revenue pool by region and by revenue source. It contrasts commercial cross-border transactions, account-related liquidity, domestic transactions, and credit cards with consumer cross-border transactions, account-related liquidity, domestic transactions, and credit cards across the four regions.
Measurement system
The blocks are labeled as percentage shares, while the totals at the bottom of each regional column give the overall revenue pool in billions of dollars: 900 for Asia-Pacific, 485 for North America, 335 for Europe, Middle East, and Africa, and 155 for Latin America. The left side also marks the separation between commercial and consumer segments.
Visible structure inside the graphic
Asia-Pacific is the tallest and widest-looking column, with large commercial blocks such as 30 for account-related liquidity and 19 for domestic transactions stacked above substantial consumer blocks of 15 and 7. North America has very large consumer blocks, especially 33 and 18, while Europe-Middle East-and-Africa shows a big 24 block in commercial domestic transactions and Latin America concentrates heavily in consumer categories at 34 and 17.
Main takeaway from the visual
Asia-Pacific dominates the global payments revenue pool by total size, while North America and the other regions show different mixes between consumer and commercial revenue sources. The chart makes that visible by giving Asia-Pacific the largest overall column and by showing noticeably different block proportions from region to region rather than a single global pattern.
Key standout values or extremes
The strongest size anchor is the 900-billion-dollar Asia-Pacific total, nearly double North America’s 485 and far above Europe’s 335 and Latin America’s 155. Within the stacks, Asia-Pacific’s 30 share for commercial account-related liquidity and North America’s 33 share for consumer domestic transactions are among the biggest printed blocks, while Latin America shows a very small 1-share block in cross-border commercial transactions.
Controls / sequence, when applicable
This is a static chart image with no in-chart controls to operate.
Companion media, when applicable
There is no separate companion audio or video; the chart image is the full visual on this page.