Source page: McKinsey & Company
Commentary
What goes up must come down—right?
COP-26 | Africa | Manufacturing | Sustainability
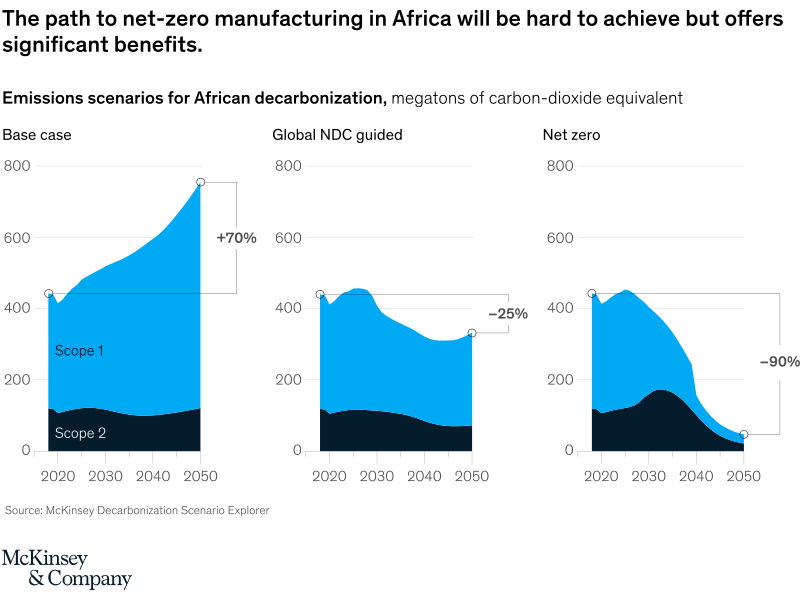
November 3, 2021 – Two possibilities for Africa’s greenhouse gas emissions, two radically different paths. In the base-case scenario, Africa’s emissions would rise by 70 percent by 2050. But to get to net-zero emissions implies a 90 percent reduction from 2018 levels. Something in between may be more likely: if Africa’s manufacturers follow the planned path of national determined contributions (NDCs), emissions may fall by about 25 percent.
To read the article, see “Africa’s green manufacturing crossroads: Choices for a low-carbon industrial future,” September 27, 2021.
customizer here
Visual form
Three-panel stacked area chart.
Layout / body structure
The chart is split into three side-by-side scenario panels labeled base case, global NDC guided, and net zero. Reader compares the same two stacked emissions layers in each panel across the 2020 to 2050 timeline, moving left to right from the highest-emissions path to the lowest-emissions path.
What is being compared
The chart compares African manufacturing emissions under three decarbonization scenarios. It contrasts total emissions and the split between Scope 1 and Scope 2 emissions over time.
Measurement system
The vertical axis is measured in megatons of carbon-dioxide equivalent up to 800, and the horizontal axis runs from 2020 to 2050. The right side of each panel also prints the overall directional result versus the starting point: plus 70 percent in the base case, minus 25 percent in the NDC-guided case, and minus 90 percent in the net-zero case.
Visible structure inside the graphic
Each panel contains a dark lower band for Scope 2 and a bright upper band for Scope 1, with circular markers at the start and end of the scenario path. In the base-case panel the stacked area rises sharply toward the upper 700s by 2050, in the NDC-guided panel it trends down modestly toward the low 300s, and in the net-zero panel both layers collapse toward a very low endpoint by 2050 after a mid-period hump.
Main takeaway from the visual
African manufacturing emissions can either rise substantially or fall dramatically depending on the decarbonization pathway chosen. The three aligned panels make that range easy to see, with the same starting point leading to three very different end states from strong growth in emissions to near-elimination.
Key standout values or extremes
The largest directional change is the plus 70 percent base-case outcome, while the most aggressive decline is the minus 90 percent net-zero path. The base-case panel ends near the mid-700 megaton range, the NDC-guided path ends around the low 300s, and the net-zero panel finishes close to the bottom of the scale by 2050.
Controls / sequence, when applicable
This is a static chart image with no in-chart controls to operate.
Companion media, when applicable
There is no separate companion audio or video; the chart image is the full visual on this page.