Source page: McKinsey & Company
Commentary
Satellites live long. Who prospers?
Aerospace | Technology
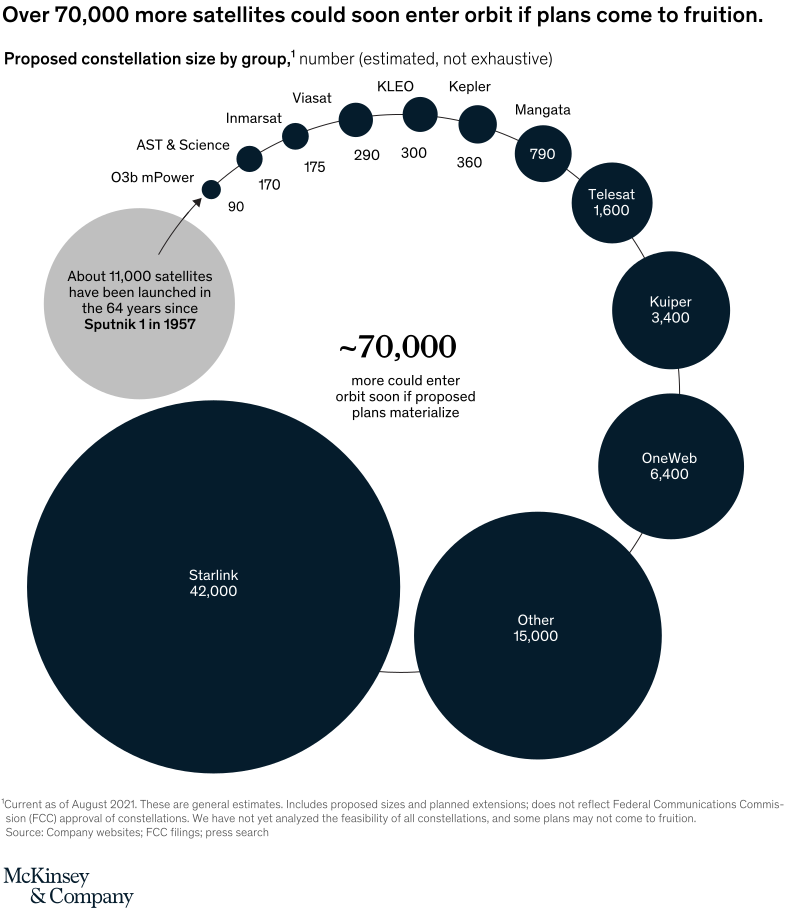
October 27, 2021 – Commercial trips to space continue, with William Shatner as the most recent suborbital space guest on a Blue Origin mission. Meanwhile, governments and private companies plan to launch as many as 70,000 satellites, adding to existing space debris that will remain there for up to hundreds of years without deorbiting efforts.
To read the article, see “Look out below: What will happen to the space debris in orbit?,” October 1, 2021.
customizer here
Visual form
Bubble-size constellation chart.
Layout / body structure
The chart arranges proposed satellite constellations as a chain of labeled circles that arcs from a small cluster at the top left down toward very large circles at the bottom. Reader compares the relative bubble sizes along that arc while also using the central annotation and the gray legacy-launch bubble to anchor the scale of the coming increase in objects in orbit.
What is being compared
The chart compares proposed satellite constellation sizes by group. It contrasts a set of named programs, from small planned constellations such as O3b mPower and AST and Science up to massive deployments such as Starlink, OneWeb, Kuiper, and the catch-all Other category.
Measurement system
The measure is the estimated number of satellites in each proposed constellation. Each circle’s area represents the size of the constellation, and the number is printed inside or beside the bubble, while a central annotation summarizes the total as roughly 70,000 additional satellites if plans materialize.
Visible structure inside the graphic
Small bubbles for O3b mPower, AST and Science, Inmarsat, Viasat, KLEO, Kepler, and Mangata sit near the top of the chain, then the circles scale up through Telesat at 1,600 and Kuiper at 3,400 before reaching OneWeb at 6,400, Other at 15,000, and Starlink at 42,000. A separate gray bubble at left notes that only about 11,000 satellites have been launched in the 64 years since Sputnik 1 in 1957, which gives the proposed additions historical context.
Main takeaway from the visual
If proposed plans proceed, the future orbital population will dwarf the historical number of satellites launched to date. The visual makes that jump unmistakable because the Starlink and Other bubbles dominate the page and collectively overwhelm the much smaller historical reference bubble.
Key standout values or extremes
Starlink is by far the biggest named program at 42,000 satellites, followed by Other at 15,000 and OneWeb at 6,400. The page also highlights that only about 11,000 satellites have been launched historically, which makes the roughly 70,000 proposed additional satellites the central scale comparison.
Controls / sequence, when applicable
This is a static chart image with no in-chart controls to operate.
Companion media, when applicable
There is no separate companion audio or video; the chart image is the full visual on this page.