Source page: McKinsey & Company
Commentary
Chunks of change
Organization | Strategy
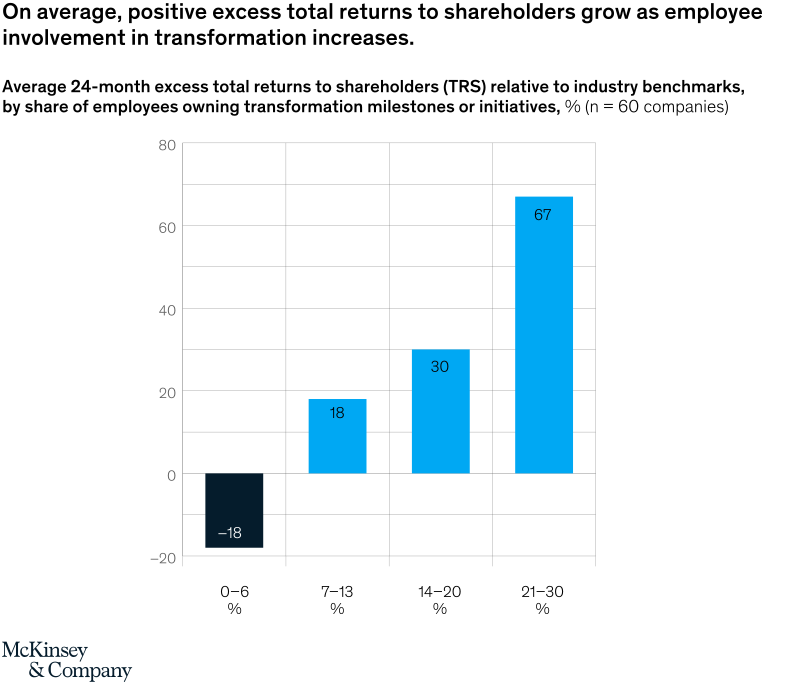
October 21, 2021 – Getting groups of employees on board in company transformations is a key to success—not only for the business itself. A new look at data from 60 companies that underwent transformations reveals that more workers involved in the process leads to higher excess total returns to shareholders.
To read the article, see “How many people are really needed in a transformation?,” September 23, 2021.
customizer here
Visual form
Four-column bar chart.
Layout / body structure
The chart is a single bar chart with four columns corresponding to ranges of employee involvement in transformation. Reader moves left to right from the 0 to 6 percent involvement bucket through the 21 to 30 percent bucket, comparing how excess total returns to shareholders change across the four participation bands.
What is being compared
The chart compares 24-month excess total returns to shareholders with the share of employees owning transformation milestones or initiatives. It is a participation-range versus performance comparison.
Measurement system
The vertical axis is percent excess total returns to shareholders relative to industry benchmarks, with zero dividing negative from positive results. The horizontal categories are employee-involvement ranges labeled 0 to 6 percent, 7 to 13 percent, 14 to 20 percent, and 21 to 30 percent.
Visible structure inside the graphic
The leftmost bar is dark and negative at minus 18, while the next three blue bars rise steadily to 18, 30, and 67. The simple four-column layout makes the relationship read like a staircase, with each successive bucket of involvement associated with a higher return outcome.
Main takeaway from the visual
Higher employee involvement in transformation is associated with stronger shareholder returns. The chart shows a clean progression from negative returns at the lowest involvement level to a very large positive outcome at the highest involvement range, with no reversal or flat middle section.
Key standout values or extremes
The lowest bucket, 0 to 6 percent employee involvement, posts minus 18 percent excess returns. The highest bucket, 21 to 30 percent involvement, reaches 67 percent, while the middle buckets sit at 18 and 30 percent respectively.
Controls / sequence, when applicable
This is a static chart image with no in-chart controls to operate.
Companion media, when applicable
There is no separate companion audio or video; the chart image is the full visual on this page.