Source page: McKinsey & Company
Commentary
Space now a trashy place
Aerospace | Technology
October 20, 2021 – As large as space stations or as small as a fleck of paint, about 27,000 pieces of space debris are floating through orbit. A collision between space debris and other matter can be catastrophic given the speed at which orbital objects travel.
To read the article, see “Look out below: What will happen to the space debris in orbit?,” October 1, 2021.
customizer here
Visual form
Stacked bar time-series chart.
Layout / body structure
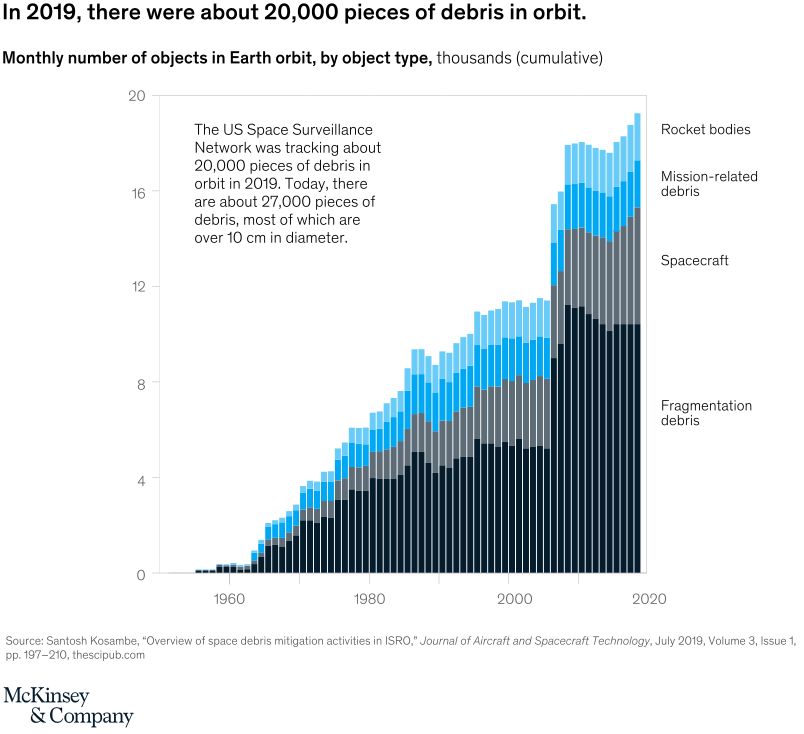
The chart is a single long time-series of stacked monthly bars running from the late 1950s to 2019. Reader follows the cumulative object count through time while also comparing how the composition of the stack shifts among fragmentation debris, spacecraft, mission-related debris, and rocket bodies.
What is being compared
The chart compares the monthly number of objects in Earth orbit by object type. It is showing both total debris growth over time and the changing contribution of different object categories to the overall orbital count.
Measurement system
The vertical axis is measured in thousands of objects, reaching roughly 20 thousand by the end of the chart. The stacked colors identify fragmentation debris, spacecraft, mission-related debris, and rocket bodies, and the central annotation calls out the move from about 20,000 pieces of tracked debris in 2019 toward roughly 27,000 today.
Visible structure inside the graphic
The bars start near zero in the early space era, then climb unevenly through the 1970s, 1980s, 1990s, and 2000s before reaching their highest levels at the right end of the chart. The darkest lower layer for fragmentation debris becomes the largest part of the stack, while lighter upper layers add spacecraft, mission-related debris, and rocket bodies on top.
Main takeaway from the visual
Orbital debris has accumulated steadily for decades, with fragmentation debris becoming the dominant component. The chart’s long upward stack and the heavy dark base make the debris problem read as cumulative and worsening rather than episodic.
Key standout values or extremes
The page highlights roughly 20,000 tracked pieces of debris in orbit in 2019 and about 27,000 today. By the end of the historical series, the full stack approaches the high teens to about 20 thousand objects, with fragmentation debris clearly the largest single component.
Controls / sequence, when applicable
This is a static chart image with no in-chart controls to operate.
Companion media, when applicable
There is no separate companion audio or video; the chart image is the full visual on this page.