Source page: McKinsey & Company
Commentary
Sounding ‘ponds, rivers, and rapids’ in corporate strategy
Strategy | Agile
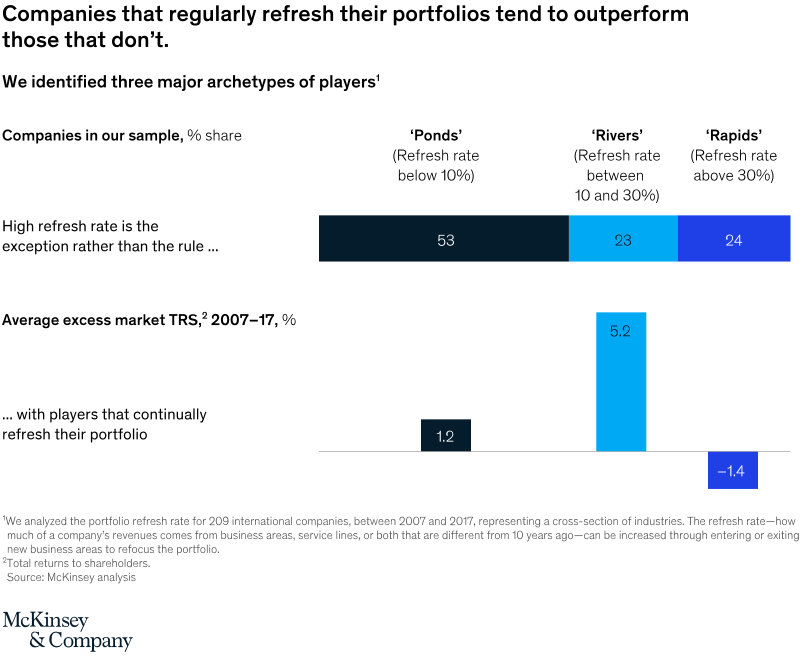
October 19, 2021 – More isn’t always better. Companies that move between 10 and 30 percent of their business mix—considered “rivers” in a recent McKinsey analysis—outperformed stagnant players (ponds) with refresh rates below 10 percent and high rates (rapids) over 30 percent. The river players saw average excess total returns to shareholders of 5.2 percent, far surpassing the ponds (1.2 percent) and rapids (–1.4 percent).
To read the article, see “Agile business portfolio management,” October 1, 2021.
customizer here
Visual form
Stacked-share bar plus three-value comparison chart.
Layout / body structure
The chart has two layers. The top layer is a single horizontal stacked bar that divides companies into three portfolio-refresh archetypes, and the bottom layer places one value marker or bar under each archetype to show average excess market total shareholder returns. Reader compares the population split first and then checks how the performance result differs for ponds, rivers, and rapids.
What is being compared
The chart compares companies by portfolio-refresh rate and then compares the associated excess market returns for each archetype. It contrasts ponds with refresh rates below 10 percent, rivers between 10 and 30 percent, and rapids above 30 percent.
Measurement system
The top bar is measured as percentage share of companies in the sample, while the bottom section measures average excess market total shareholder returns in percent over 2007 to 2017. The two layers work together to show both how common each archetype is and how it performs.
Visible structure inside the graphic
The top stacked bar shows ponds as the largest segment at 53 percent, rivers at 23 percent, and rapids at 24 percent. Below, the return markers show 1.2 percent for ponds, 5.2 percent for rivers, and negative 1.4 percent for rapids, making the middle category the only one with a clearly strong positive outperformance signal.
Main takeaway from the visual
Companies that refresh their portfolios regularly but not excessively tend to outperform. The chart makes rivers stand out by pairing a smaller population share than ponds with the strongest positive excess returns, while rapids refresh too aggressively and end up below zero.
Key standout values or extremes
Ponds account for 53 percent of companies but generate only 1.2 percent average excess market returns. Rivers represent 23 percent of the sample and produce the highest return at 5.2 percent, while rapids make up 24 percent and post negative 1.4 percent, the weakest result on the chart.
Controls / sequence, when applicable
This is a static chart image with no in-chart controls to operate.
Companion media, when applicable
There is no separate companion audio or video; the chart image is the full visual on this page.