Source page: McKinsey & Company
Commentary
Delta and its discontents
COVID-19 | Economy
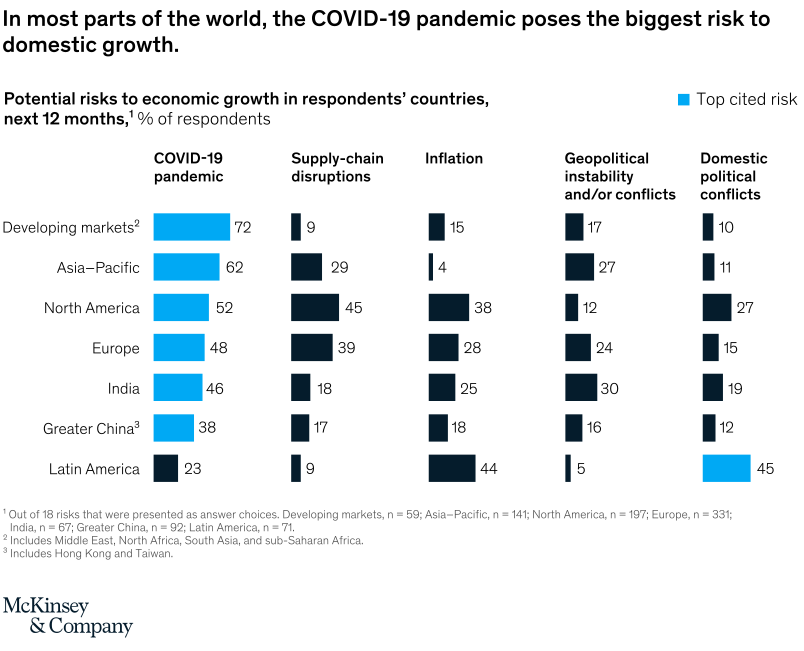
October 14, 2021 – Last quarter, just 36 percent of respondents to our global executive survey cited the pandemic as a risk to domestic growth over the next year—the smallest share to say so since we began asking in March 2020. That figure is now up to 49 percent, thanks to the spread of the variant. But in Latin America, domestic political conflicts are weighing more heavily on sentiment.
To read the survey, see “Economic conditions outlook, September 2021,” September 29, 2021.
customizer here
Visual form
Matrix-style grouped horizontal bar chart.
Layout / body structure
The chart is laid out as one wide matrix with regions stacked vertically and five risk categories arranged as columns across the page. Read each row from left to right to compare how one region distributes concern across pandemic, supply-chain, inflation, geopolitical, and domestic political risks.
What is being compared
The chart compares the top perceived risks to domestic economic growth over the next 12 months across seven regional groupings: developing markets, Asia-Pacific, North America, Europe, India, Greater China, and Latin America. It is a region-by-risk comparison rather than a time-series view.
Measurement system
The measurement is the percentage of respondents citing each risk. The bars are labeled numerically, and blue is used to highlight the top-cited risk within a region while the remaining risks appear in dark bars.
Visible structure inside the graphic
Five bar columns divide the page by risk type, and each region row carries one horizontal bar inside each column. The matrix lets the reader scan either down a single risk category to compare regions or across one region to see which concern dominates that market.
Main takeaway from the visual
The pandemic is still the dominant threat in most regions, but the matrix also shows that the pattern is not uniform: Latin America stands out for domestic political conflict and inflation, while North America and Europe show especially strong supply-chain and inflation concern alongside COVID-19.
Key standout values or extremes
The highest bar on the page is 72 percent for developing markets citing the COVID-19 pandemic, followed by 62 percent in Asia-Pacific. North America shows 52 percent for pandemic risk and 45 percent for supply-chain disruptions, Europe shows 48 percent and 39 percent on those same measures, and Latin America stands out with 45 percent for domestic political conflicts and 44 percent for inflation.
Controls / sequence, when applicable
This is a static chart image with no in-chart controls to operate.
Companion media, when applicable
There is no separate companion audio or video; the chart image is the full visual on this page.