Source page: McKinsey & Company
Commentary
To be precise
Innovation | Advanced industries
October 1, 2021 – Smaller US manufacturers have a hard time keeping pace with their bigger brothers. How can they catch up? Our new research suggests that three factors make most of the difference: precision in manufacturing, the ability to handle geometrically complex designs, and throughput speed. Those are the core ingredients of McKinsey’s new Manufacturing Process Innovation Index.
To read the article, see “Manufacturing process innovation for industrials,” September 16, 2021.
customizer here
Visual form
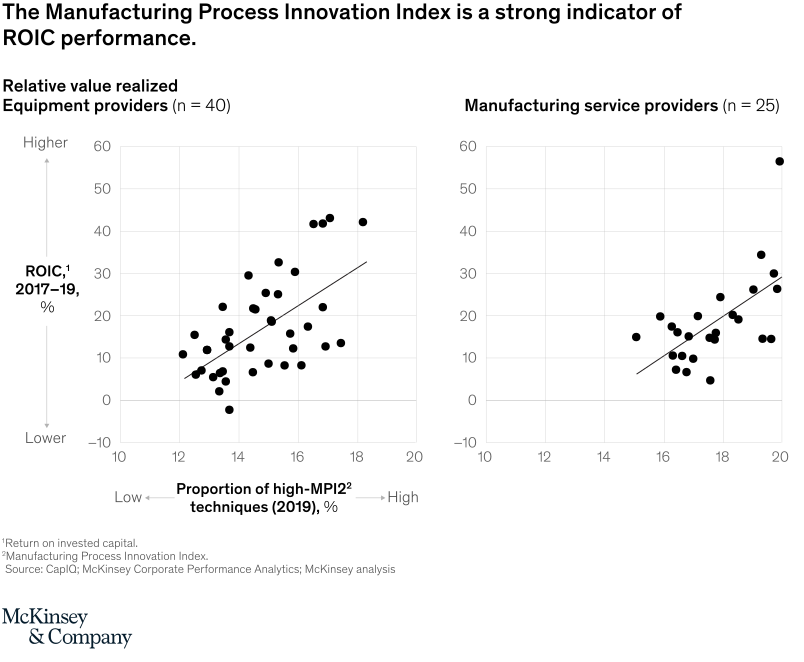
Two-panel scatter plot with trend lines.
Layout / body structure
The chart places two scatter panels side by side, one for equipment providers and one for manufacturing service providers. Reader scans the left plot first and then the right plot, using the common axis framing to compare the same relationship across both provider groups.
What is being compared
Both panels compare the proportion of high Manufacturing Process Innovation Index techniques used in 2019 against ROIC performance from 2017 to 2019. The chart therefore compares innovation intensity on the horizontal axis with financial performance on the vertical axis for two different types of manufacturing companies.
Measurement system
The horizontal axis is the proportion of high-MPI techniques in percent, running from low to high across roughly 10 to 20 percent. The vertical axis is ROIC in percent, running from about -10 to 60, and each panel includes a fitted trend line to summarize the overall relationship.
Visible structure inside the graphic
Each panel contains a field of black dots for individual companies and a black upward-sloping regression line laid across the cloud. The shared grid lines and mirrored panel layout make it easy to compare how tightly the dots cluster and how strongly the relationship slopes upward in each group.
Main takeaway from the visual
The paired scatter plots show a positive relationship between using more high-MPI techniques and realizing higher ROIC in both equipment providers and manufacturing service providers. The relationship is visible in both panels, which is why the chart frames the index as a meaningful performance indicator rather than a niche operational measure.
Key standout values or extremes
In the equipment-provider panel, the highest points sit in the low 40s for ROIC at roughly 17 to 18 percent high-MPI usage. In the manufacturing-service-provider panel, the most prominent outlier reaches the mid-50s for ROIC near 20 percent high-MPI usage, while the broader cluster still trends upward from the mid-teens to around 30 percent ROIC.
Controls / sequence, when applicable
This is a static chart image with no in-chart controls to operate.
Companion media, when applicable
There is no separate companion audio or video; the chart image is the full visual on this page.