Source page: McKinsey & Company
Commentary
The mothers of invention
Innovation | COVID-19
September 29, 2021 – After World War II, companies came up with dishwashers and clothes dryers to assist working women. After the SARS epidemic, Asian innovators made remote banking and buying easier. After the 2008 financial crisis, companies came up with the sharing economy, to make the most of stranded assets and an unemployed workforce. The lesson? Those who innovate through a crisis come out stronger.
To read the podcast transcript, see “Innovation—the launchpad out of the crisis,” September 15, 2021.
customizer here
Visual form
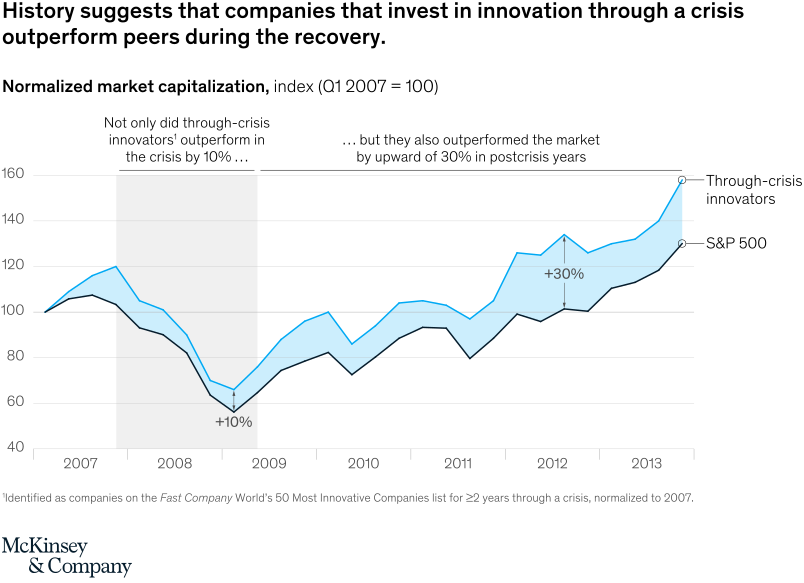
Single-panel two-line time-series chart with shaded spread.
Layout / body structure
The chart runs left to right from 2007 through 2013 with a shaded crisis period early in the timeline and a long recovery period after it. Reader follows the blue through-crisis-innovators line against the darker S&P 500 line and uses the shaded gap and callouts to track how the spread changes over time.
What is being compared
The chart compares normalized market capitalization for through-crisis innovators against the S&P 500. It is both a crisis-period comparison and a postcrisis recovery comparison using the same two lines across the full timeline.
Measurement system
The vertical axis is a normalized market-capitalization index with Q1 2007 set to 100, and the scale runs from roughly 40 to 160. The annotations call out relative spreads of 10 percent during the crisis trough and 30 percent in the postcrisis years.
Visible structure inside the graphic
A blue line for through-crisis innovators stays above a darker market line for much of the period, and the space between them is filled with light blue shading to make the performance gap visible. A gray vertical band marks the crisis interval, while arrows and text callouts pin the viewer to the widening spread at key moments.
Main takeaway from the visual
The chart shows innovators outperforming peers during the downturn and then widening that advantage after the crisis, which makes innovation look like a durable recovery advantage rather than a short-lived defensive move.
Key standout values or extremes
Near the 2008 to 2009 trough, the innovators line sits about 10 percent above the market line, with the two series landing around the mid-60s and mid-50s respectively. By 2013, the innovators line rises to the high 150s while the S&P 500 ends around 130, matching the annotated postcrisis outperformance of roughly 30 percent.
Controls / sequence, when applicable
This is a static chart image with no in-chart controls to operate.
Companion media, when applicable
There is no separate companion audio or video; the chart image is the full visual on this page.