Source page: McKinsey & Company
Commentary
Streamlining submissions for faster drug approvals
Life Sciences | North America
September 28, 2021 – The development of vaccines for COVID-19 made clear the value of being first to market. Pharmaceutical companies that optimize their drug-submission process can expedite the approval timeline from an average of about eight months by collaborating with regulators and simplifying strategies.
To read the article, see “Getting strategic about new-product submissions in the pharma industry,” September 16, 2021.
customizer here
Visual form
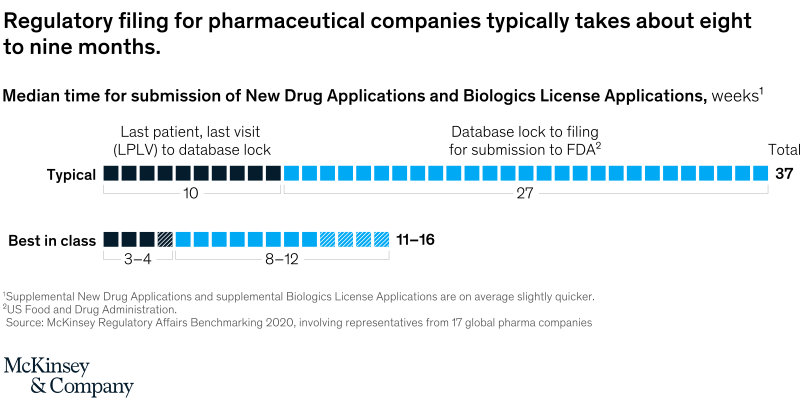
Two-row segmented duration bar chart.
Layout / body structure
The chart uses one long bar for the typical process on top and a shorter ranged bar for best in class below it. Read the dark left segment first for the LPLV-to-database-lock stage and then the blue right segment for the database-lock-to-FDA-submission stage before comparing the total durations at the far right.
What is being compared
The chart compares the median submission time for New Drug Applications and Biologics License Applications between a typical process and a best-in-class process. It also compares the two internal phases that make up that total timeline.
Measurement system
The measurement is weeks. The typical row is shown as 10 weeks for LPLV to database lock plus 27 weeks for database lock to FDA submission, while the best-in-class row is shown as ranges of 3 to 4 weeks and 8 to 12 weeks for a total of 11 to 16 weeks.
Visible structure inside the graphic
Both rows are composed of repeated block segments, with dark blocks for the first phase and blue blocks for the second phase. The best-in-class bar includes hatched range segments, while the top row ends with a bold total of 37 and the lower row ends with the range total of 11 to 16.
Main takeaway from the visual
The chart shows that regulatory filing timelines can be compressed dramatically, with best-in-class organizations moving through both stages much faster than the typical pharmaceutical submission process.
Key standout values or extremes
The most visible anchor is the total drop from 37 weeks in the typical process to 11 to 16 weeks in the best-in-class range. Within that total, the first phase falls from 10 weeks to 3 to 4 weeks and the second phase shrinks from 27 weeks to 8 to 12 weeks.
Controls / sequence, when applicable
This is a static chart image with no in-chart controls to operate.
Companion media, when applicable
There is no separate companion audio or video; the chart image is the full visual on this page.