Source page: McKinsey & Company
Commentary
Consumers in US, Europe, and China spending like it’s 2019
Retail | Economy | COVID-19
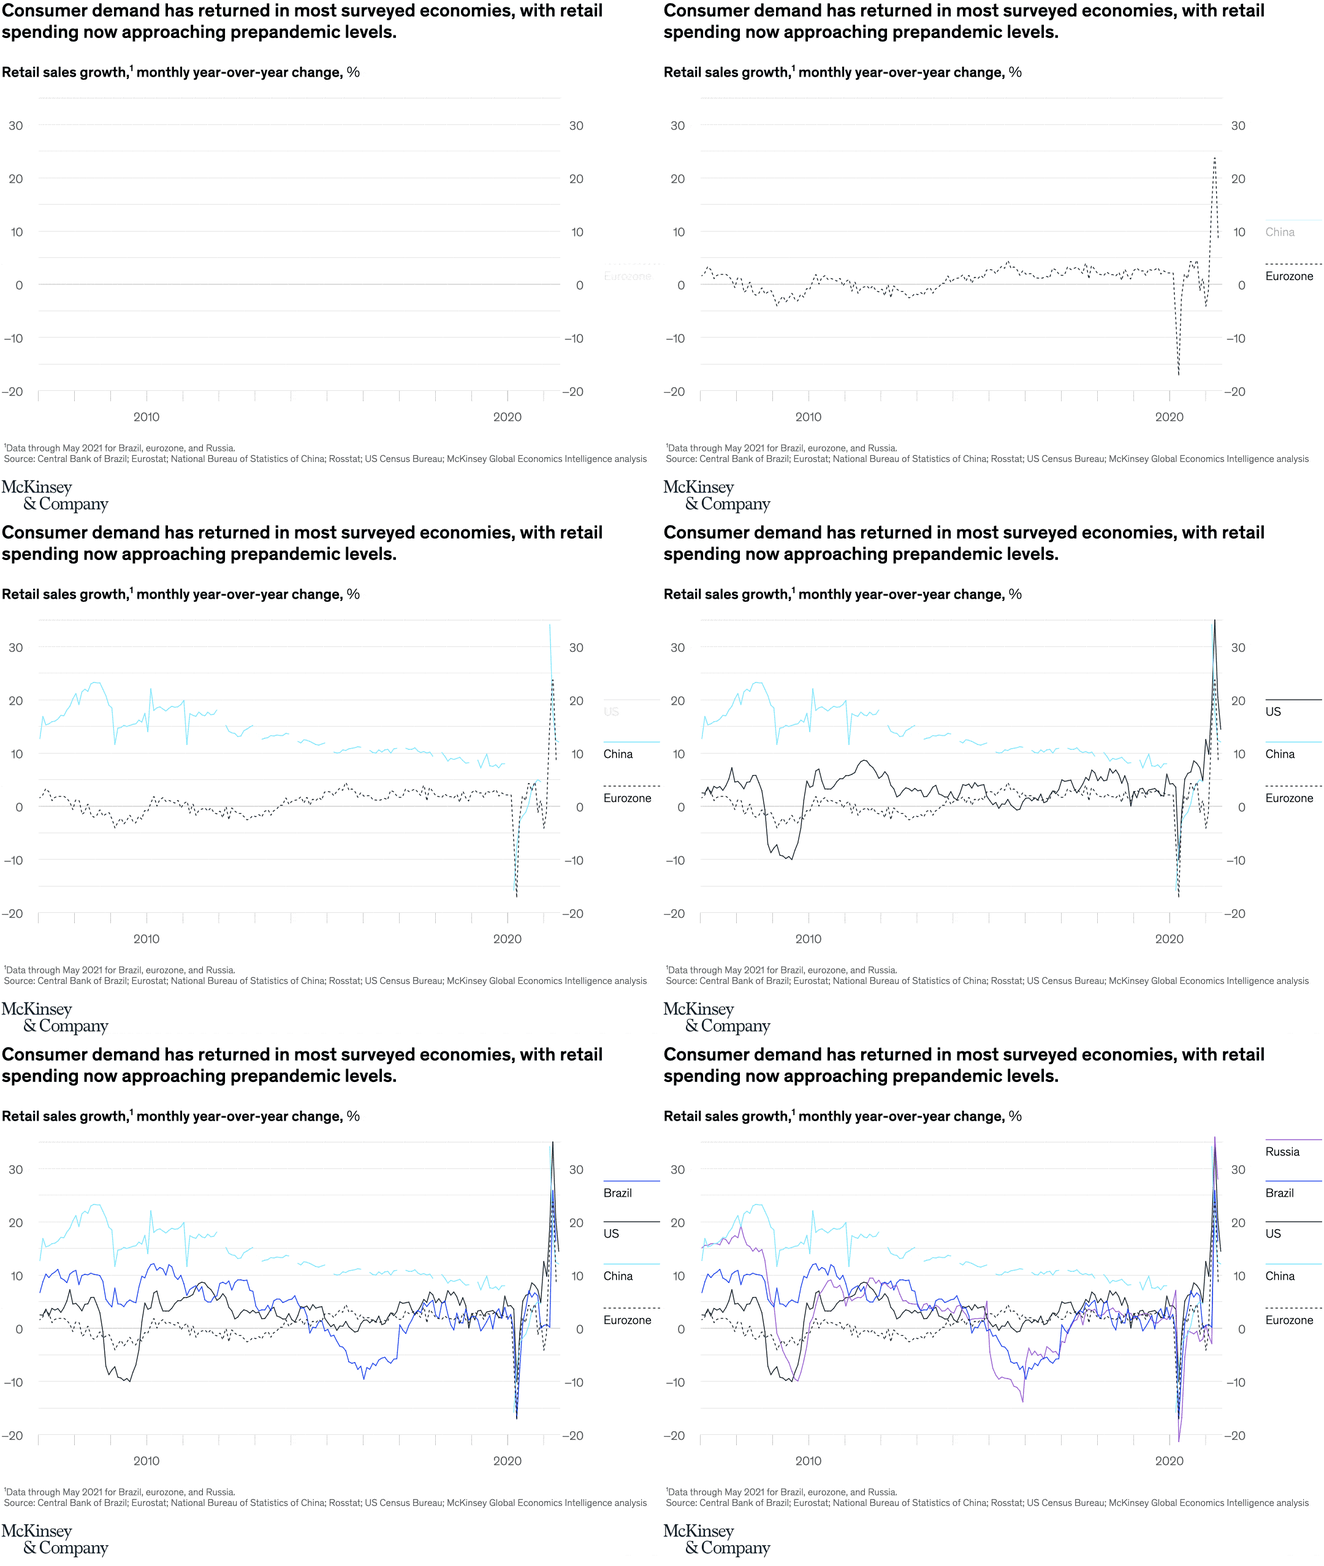
September 15, 2021 – Retail spending is reaching prepandemic norms. Month-over-month retail sales were up 0.6 and 4.6 percent in the United States and the eurozone, respectively, over the summer. China marked a rise of 12.1 percent compared with last year, indicating strengthened consumer confidence.
To read the article, see “Global Economics Intelligence executive summary, July 2021,” August 9, 2021.
customizer here
Visual form
Animated multi-line time-series chart.
Layout / body structure
The visual is a single line chart that gradually draws multiple country series onto one shared time axis. Reader follows the animation from an empty grid to a fully populated chart and then reads the finished right-side legend to separate Russia, Brazil, the United States, China, and the Eurozone.
What is being compared
The chart compares monthly year-over-year retail sales growth across five economies. It is a country-by-country time-series comparison from roughly 2007 through 2021 rather than a snapshot chart.
Measurement system
The vertical axis is percent year-over-year retail sales growth and runs from about negative 20 to positive 30. Each country is represented by a differently colored line, with the Eurozone shown as a dashed series and the other economies shown as solid lines.
Visible structure inside the graphic
The completed frame shows five lines moving across the full timeline, a right-edge legend, and a sharp pandemic dip around 2020 followed by a rapid rebound spike. China runs high for much of the earlier period, the Eurozone hovers closer to zero, and Russia, Brazil, and the United States swing more sharply around the COVID shock and recovery.
Main takeaway from the visual
The animation shows consumer demand returning across most surveyed economies, with retail spending rebounding toward or past prepandemic patterns after the sharp 2020 collapse. The multi-line layout makes it clear that the rebound is broad, even though the timing and volatility differ by country.
Key standout values or extremes
In the finished frame, several series plunge to roughly negative 20 around the 2020 shock and then surge into the 20s or even mid-30s on the rebound. Russia shows the strongest final spike in the mid-30s, Brazil also jumps into the upper 20s, the United States rebounds into the teens, and China stays comparatively positive through much of the earlier timeline before settling lower near the end.
Controls / sequence, when applicable
This is a static chart image with no in-chart controls to operate.
Companion media, when applicable
There is no separate companion audio or video; the chart image is the full visual on this page.