Source page: McKinsey & Company
Commentary
Fashion's bias cut
Diversity & Inclusion | Retail
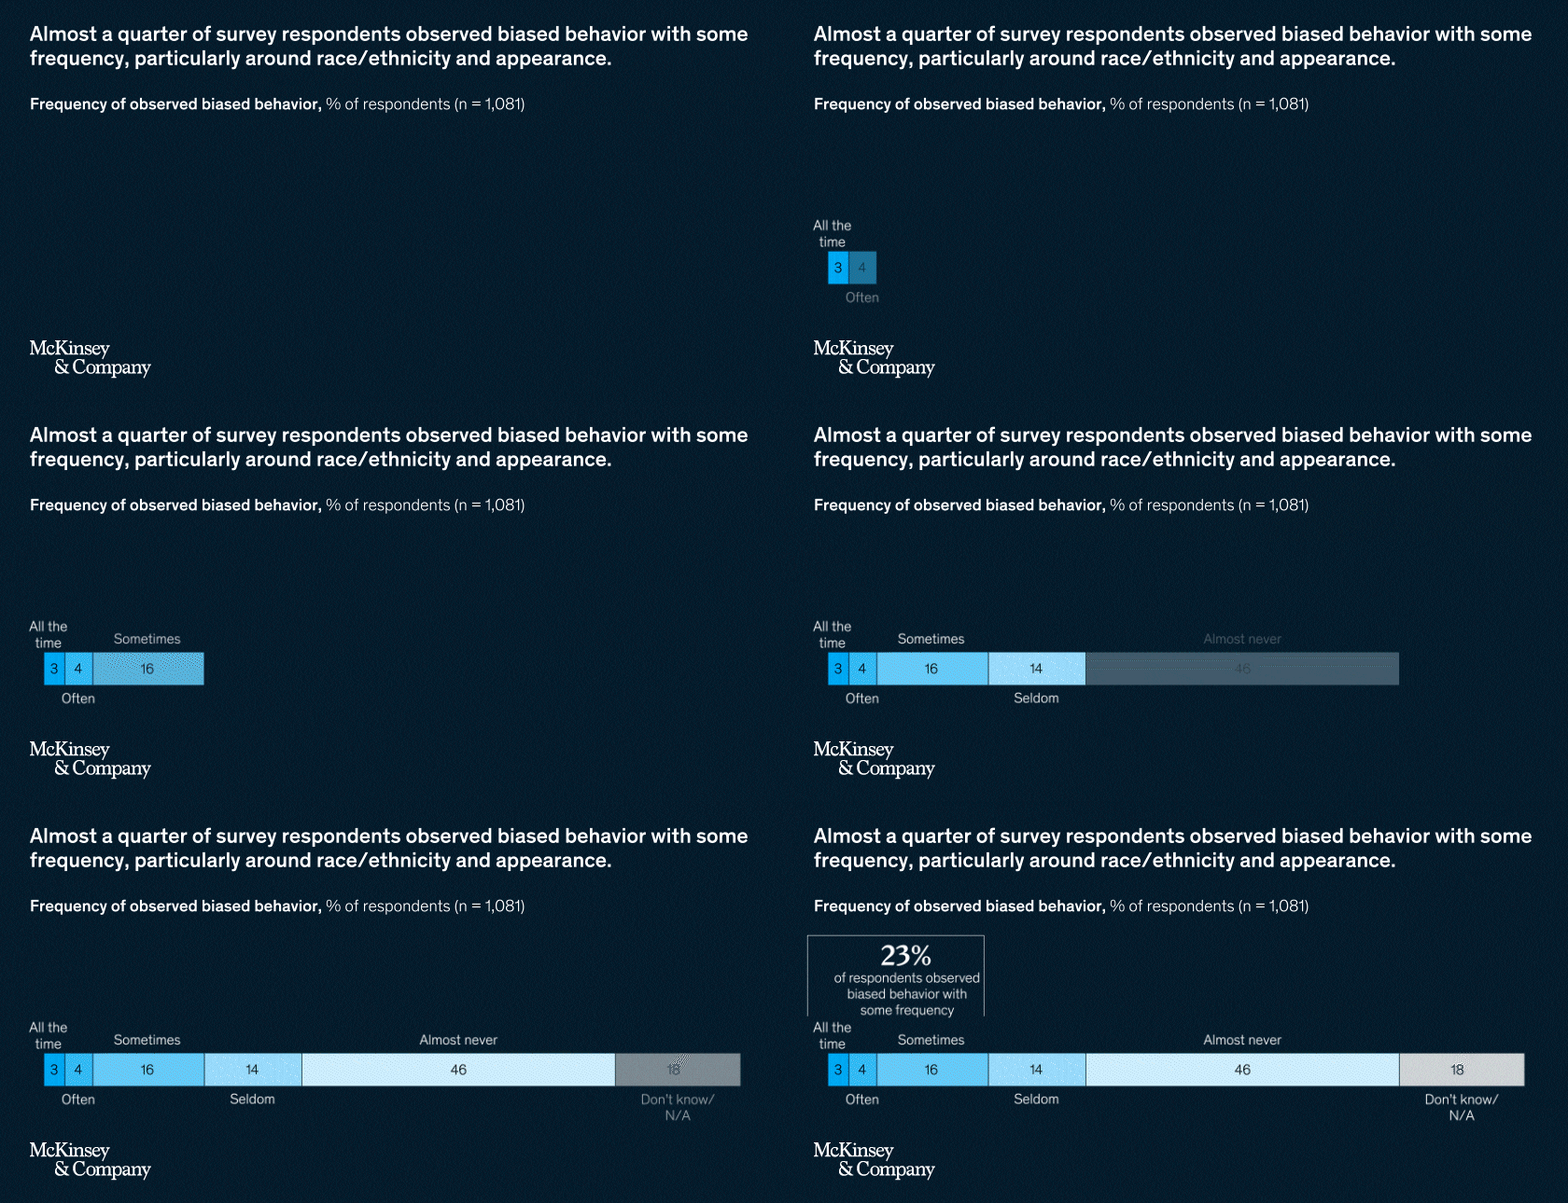
August 12, 2021 – Almost a quarter of fashion employees say they have seen biased behavior in the workplace, usually based on race, ethnicity, or appearance. A Black fashion executive told us, “I’ve had a white peer say to me that I don’t have to worry about layoffs because [the company] can’t let go of the Black person, or they verbalize that they think I got a promotion because I’m Black.”
To explore the interactive, see “Voices and viewpoints of fashion students and emerging designers,” July 20, 2021.
customizer here
Visual form
Single stacked horizontal bar chart with an inset callout box.
Layout / body structure
The chart is a compact one-row composition. Read the callout box at upper left first for the overall share observing biased behavior with some frequency, then read the long stacked bar from left to right across the frequency categories.
What is being compared
The chart compares the frequency with which respondents observe biased behavior, splitting responses across often, sometimes, seldom, almost never, and don’t know or not applicable.
Measurement system
The bar encodes percent of respondents, with each segment labeled directly by its numeric share. A boxed callout summarizes the combined share observing biased behavior with some frequency.
Visible structure inside the graphic
A dark background frames a single horizontal stacked bar made of six labeled segments, with smaller left segments for the more frequent responses and much larger pale segments for the less frequent ones. Above and beside the bar, the chart places category labels and a boxed 23 percent callout that summarizes the headline figure.
Main takeaway from the visual
Most respondents place observed biased behavior in the seldom or almost-never part of the scale, but a meaningful minority still sees it with some frequency. The visual makes that tension clear by pairing a very large light segment on the right with a prominent 23 percent summary box for the more frequent side.
Key standout values or extremes
The individual segments are labeled 3 percent and 4 percent for the most frequent responses, 16 percent for sometimes, 14 percent for seldom, 46 percent for almost never, and 18 percent for don’t know or not applicable. The inset callout highlights that 23 percent of respondents observed biased behavior with some frequency.
Controls / sequence, when applicable
This is a static chart image with no in-chart controls to operate.
Companion media, when applicable
There is no separate companion audio or video; the chart image is the full visual on this page.