Source page: McKinsey & Company
Commentary
Sales soared–if you had the goods online
Economy | Retail | COVID-19
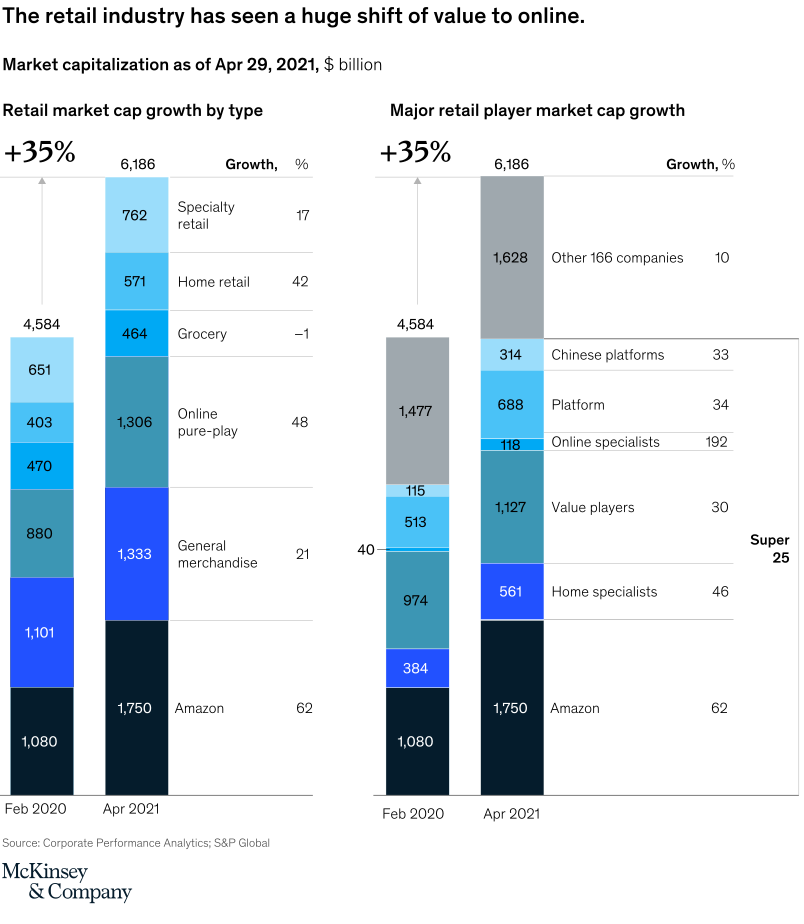
August 2, 2021 – Retailers saw business go up during the COVID-19 pandemic, but not all subsectors of the industry had success. Business apparel purchases plummeted while home renovation and décor companies saw consumers adding to their digital carts. Regional differences were at play, too: Chinese and US companies captured three-fourths of retail’s market-cap growth.
To read the article, see “Why retail outperformers are pulling ahead,” July 8, 2021.
customizer here
Visual form
Two-panel stacked-column decomposition chart.
Layout / body structure
The chart places two stacked-column comparisons side by side. Read the left panel first for retail market-cap growth by retail type, then move to the right panel for the same growth decomposed by major retail-player group.
What is being compared
Both panels compare retail market capitalization in February 2020 versus April 2021. The left panel breaks the increase down by retail type, while the right panel breaks it down by major retail-player categories such as Amazon, home specialists, value players, online specialists, platform players, Chinese platforms, and the remaining companies.
Measurement system
The values are in billions of dollars, and each stacked segment is labeled directly with its contribution size. A +35 percent headline summarizes the overall rise from 4,584 to 6,186, and the right margin of each stack lists percentage growth rates for the component categories.
Visible structure inside the graphic
Each panel contains a shorter February 2020 stack beside a taller April 2021 stack, with colored segments arranged vertically and labels aligned to the right. The left panel groups the market by type, while the right panel uses a different set of categories but the same two-date structure, so the reader can compare both the size of the total increase and who captured it.
Main takeaway from the visual
The industry added a large amount of market value overall, but the gains were concentrated in online and digitally advantaged groups rather than spread evenly across all retail categories. The strongest visual growth sits in the segments tied to Amazon, general merchandise, online pure-plays, and specialist online players, while grocery barely moves or slips.
Key standout values or extremes
Total market cap rises from 4,584 to 6,186, a 35 percent increase. In the type view, Amazon grows 62 percent, online pure-play 48 percent, home retail 42 percent, general merchandise 21 percent, specialty retail 17 percent, and grocery falls 1 percent. In the player view, online specialists post the largest growth rate at 192 percent, home specialists 46 percent, platform players 34 percent, Chinese platforms 33 percent, value players 30 percent, other 166 companies 10 percent, and Amazon again 62 percent.
Controls / sequence, when applicable
This is a static chart image with no in-chart controls to operate.
Companion media, when applicable
There is no separate companion audio or video; the chart image is the full visual on this page.