Source page: McKinsey & Company
Commentary
Et tu, e-tail?
COVID-19 | Economy | Retail
July 27, 2021 – Digitally forward retailers are expanding their lead over laggards. Retailers with a strong omnichannel presence were in an ideal position to capitalize when the COVID-19 pandemic forced consumers to make many of their purchases online. Companies that didn’t prioritize e-commerce may not catch up.
To read the article, see “Why retail outperformers are pulling ahead,” July 8, 2021.
customizer here
Visual form
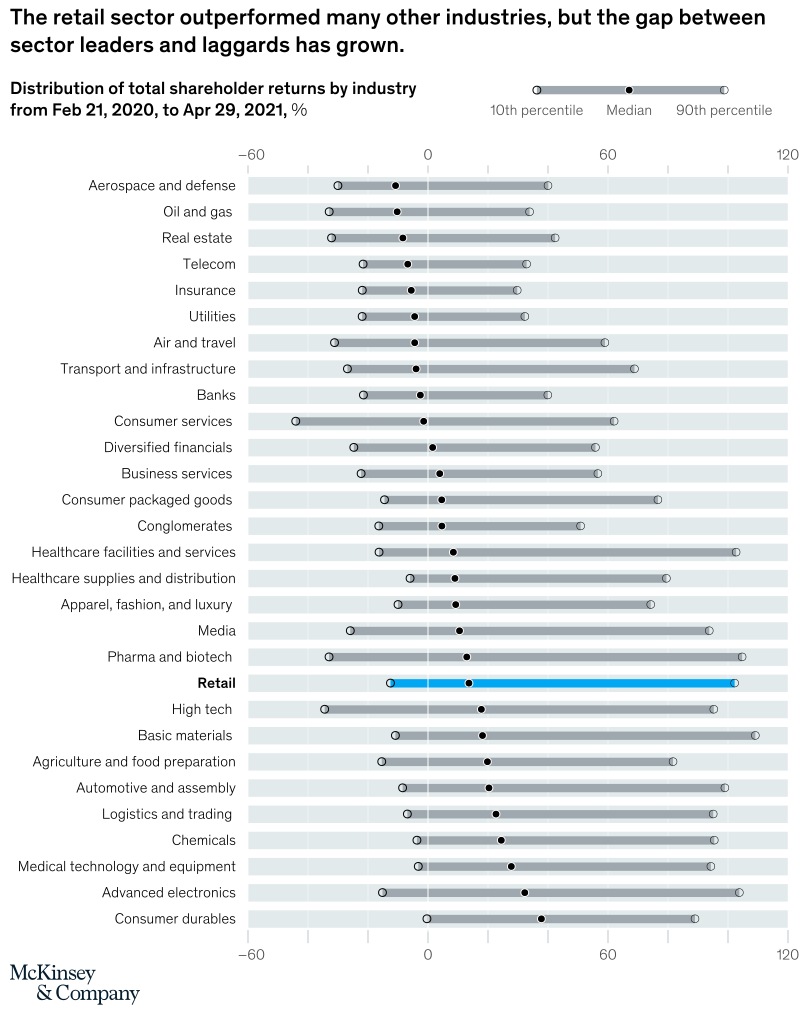
Industry percentile-range comparison chart.
Layout / body structure
The chart is a single long ranked table of industries from top to bottom on a shared horizontal return scale. Read each row across from the 10th percentile marker through the median to the 90th percentile marker, then compare where the highlighted retail row sits against the rest.
What is being compared
The chart compares the distribution of total shareholder returns across many industries from February 21, 2020, to April 29, 2021. Each row compares the spread within one industry, and the full chart compares industries against one another, with retail highlighted.
Measurement system
The horizontal axis measures total shareholder return in percent. For each industry, the left open circle marks the 10th percentile, the filled center dot marks the median, and the right open circle marks the 90th percentile.
Visible structure inside the graphic
Every industry row contains a horizontal range bar with three markers on it. The retail row is highlighted in blue while the rest are gray, and a legend at the top explains the meaning of the 10th percentile, median, and 90th percentile markers.
Main takeaway from the visual
Retail outperformed many industries overall, but the range within retail is wide, which shows that leadership and laggard outcomes separated sharply. The highlighted row sits in the stronger part of the table, yet its long span makes internal divergence part of the headline rather than just sector strength alone.
Key standout values or extremes
The scale runs from about -60 to 120 percent. The retail row has its 10th percentile slightly below zero, its median around the mid-teens, and its 90th percentile a little above 100, giving it one of the broadest positive ranges on the page. Several weaker sectors near the top have medians below zero or only slightly above it, while stronger sectors lower in the table also stretch toward the 100-plus zone.
Controls / sequence, when applicable
This is a static chart image with no in-chart controls to operate.
Companion media, when applicable
There is no separate companion audio or video; the chart image is the full visual on this page.