Source page: McKinsey & Company
Commentary
Resolved: Digital makes a difference
Digital | Technology
July 12, 2021 – Is technology truly a differentiator in business? The latest McKinsey Global Survey settles the long-running debate. Those companies that have invested in tech and digital over the years, to build what we call a “technology endowment,” are now significantly ahead of peers that dedicated less time, effort, and capital to the effort.
To read the article, see “The new digital edge: Rethinking strategy for the postpandemic era,” May 26, 2021.
customizer here
Visual form
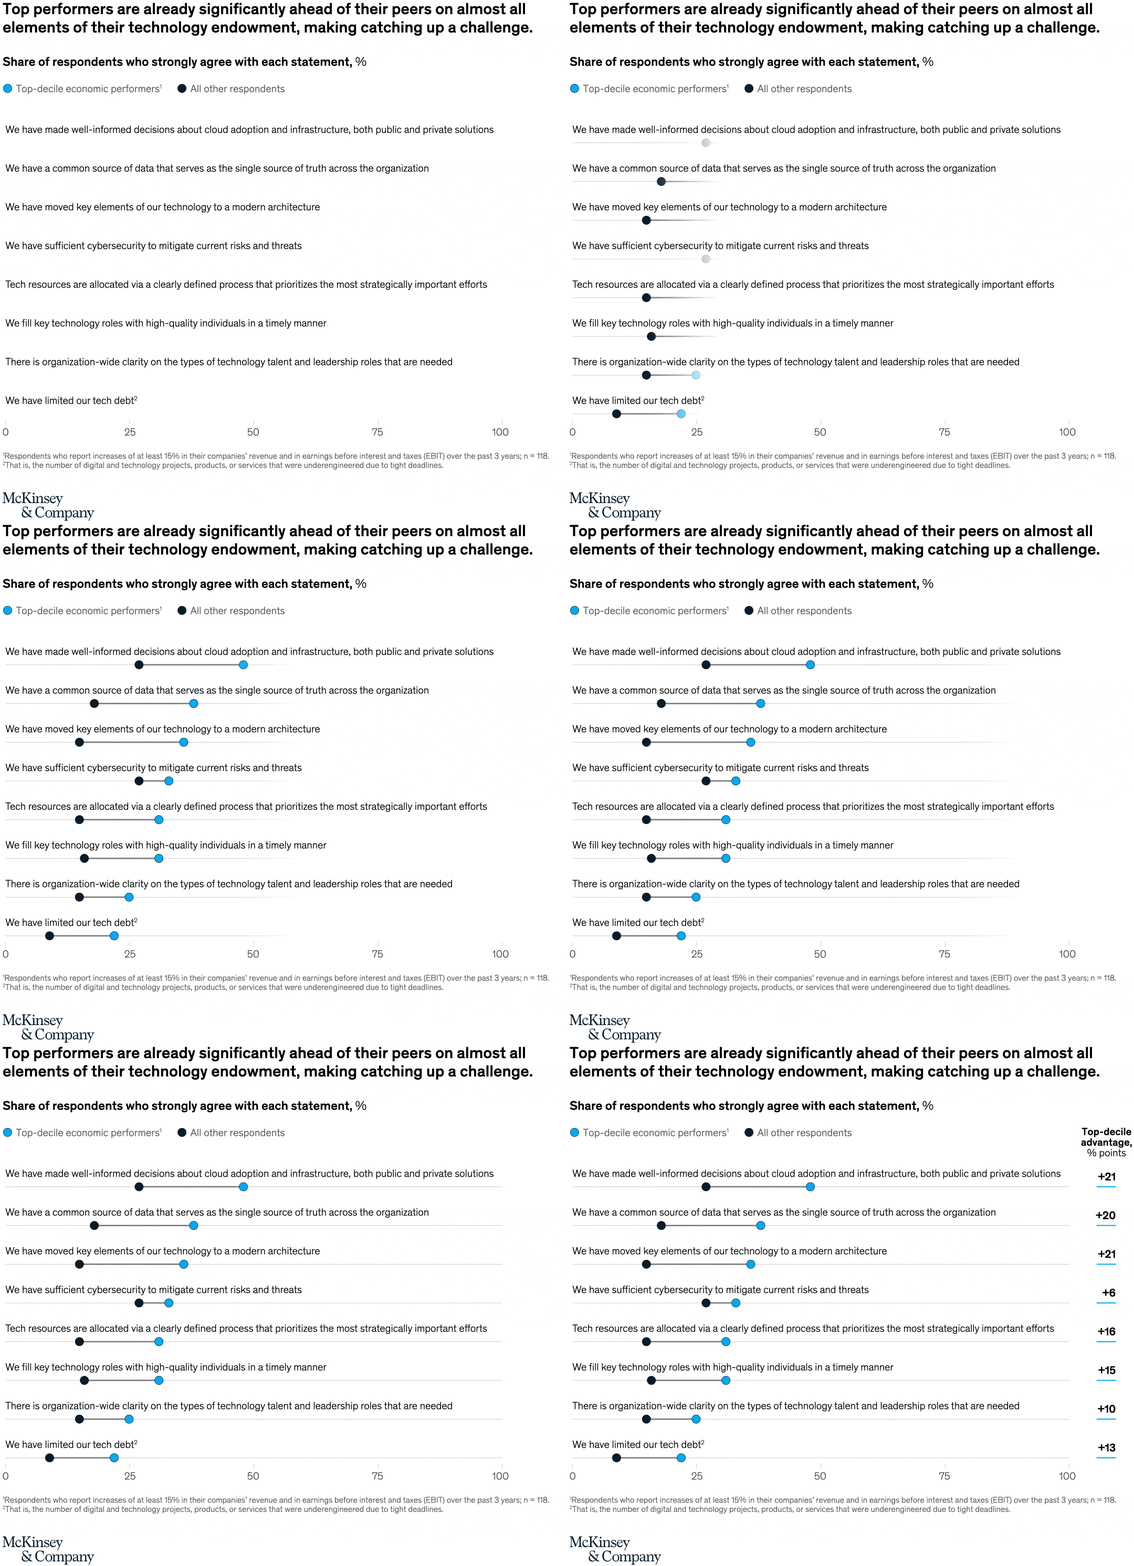
Multi-row dumbbell plot.
Layout / body structure
The chart is a single stacked list of statement rows on one horizontal percentage scale. Reader works from top to bottom, reading each statement at left, then comparing the black and blue dots on the row, and finally checking the right-hand advantage column for the size of the spread.
What is being compared
The chart compares the share of top-decile economic performers and all other respondents who strongly agree with statements about technology endowment, cloud adoption, common data, modern architecture, cybersecurity, resource allocation, talent, role clarity, and tech debt.
Measurement system
The measurement is share of respondents, in percent, on a 0 to 100 horizontal scale. A separate right-hand column converts each row’s dot spacing into a top-decile advantage measured in percentage points.
Visible structure inside the graphic
Each statement row contains two colored dots connected by a thin horizontal line, with the blue dot for top-decile performers consistently placed to the right of the darker dot for all other respondents. The far-right margin adds a clean numeric advantage marker for each row, including +21, +20, +21, +6, +16, +15, +10, and +13.
Main takeaway from the visual
Top performers sit visibly ahead of the rest on nearly every technology-endowment statement, and the separation is not confined to one narrow topic. The widest visible gaps cluster around cloud adoption, modern architecture, and shared data foundations, which makes catching up look like a broad systems challenge rather than a single-tool fix.
Key standout values or extremes
The largest visible advantages are +21 on cloud adoption and infrastructure and +21 on moving key technology elements to a modern architecture, with a near-match at +20 for having a common source of data. Cybersecurity is the narrowest row at +6, while the remaining rows still show double-digit gaps of +16, +15, +10, and +13.
Controls / sequence, when applicable
This is a static chart image with no in-chart controls to operate.
Companion media, when applicable
There is no separate companion audio or video; the chart image is the full visual on this page.