Source page: McKinsey & Company
Commentary
What is and what could be
Economy | Diversity & Inclusion | North America
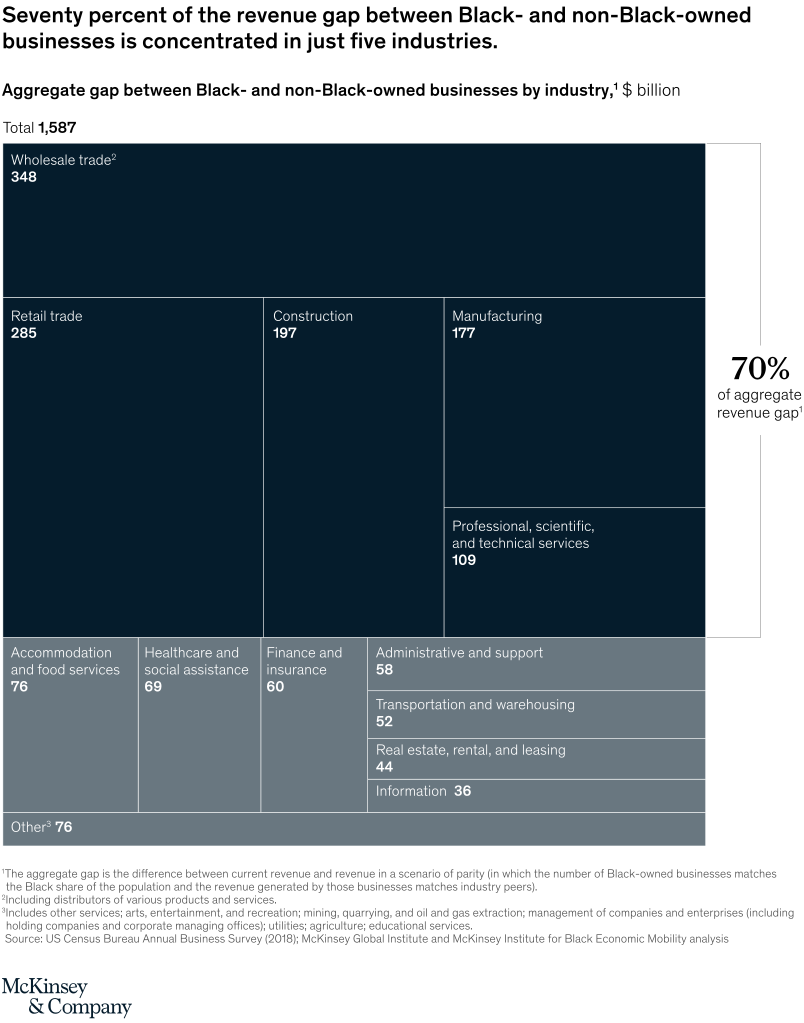
July 2, 2021 – If Black-owned businesses operated at parity with others, they would generate $1.6 trillion more than they do today. The revenue gap is highly concentrated. Seventy percent of the shortfall occurs in just five industries: wholesale trade, retail trade, construction, manufacturing, and professional services.
To read the report, see “The economic state of Black America: What is and what could be,” June 17, 2021.
customizer here
Visual form
Treemap chart.
Layout / body structure
The chart is a single treemap with a narrow callout bracket on the right. Reader scans the large dark blocks first to identify the biggest industries in the aggregate gap, then moves through the smaller gray blocks below, and finally reads the right-side 70 percent annotation that summarizes how concentrated the total is.
What is being compared
The chart compares the aggregate revenue gap between Black-owned and non-Black-owned businesses across industries, showing how much of the total gap is concentrated in each industry block.
Measurement system
The measurement is billions of dollars. Block area represents the size of each industry’s contribution to the revenue gap, the total is labeled at 1,587, and individual industries are labeled directly with their dollar amounts.
Visible structure inside the graphic
The treemap is dominated by five dark blocks at the top and middle – wholesale trade, retail trade, construction, manufacturing, and professional, scientific, and technical services – while a band of smaller gray rectangles below contains the rest of the industries. A right-side bracket and annotation tie those top five blocks to the statement that they account for 70 percent of the aggregate gap.
Main takeaway from the visual
The revenue gap is highly concentrated rather than evenly spread across the economy. The five largest industries visually dominate the treemap, and the separate 70 percent annotation confirms that most of the total shortfall sits inside that small set of sectors.
Key standout values or extremes
Wholesale trade is the largest block at 348 billion, followed by retail trade at 285, construction at 197, manufacturing at 177, and professional, scientific, and technical services at 109. Together those five large dark blocks account for the highlighted 70 percent share of the 1,587 billion total.
Controls / sequence, when applicable
This is a static chart image with no in-chart controls to operate.
Companion media, when applicable
There is no separate companion audio or video; the chart image is the full visual on this page.