Source page: McKinsey & Company
Commentary
The real thing
Food | Biotech
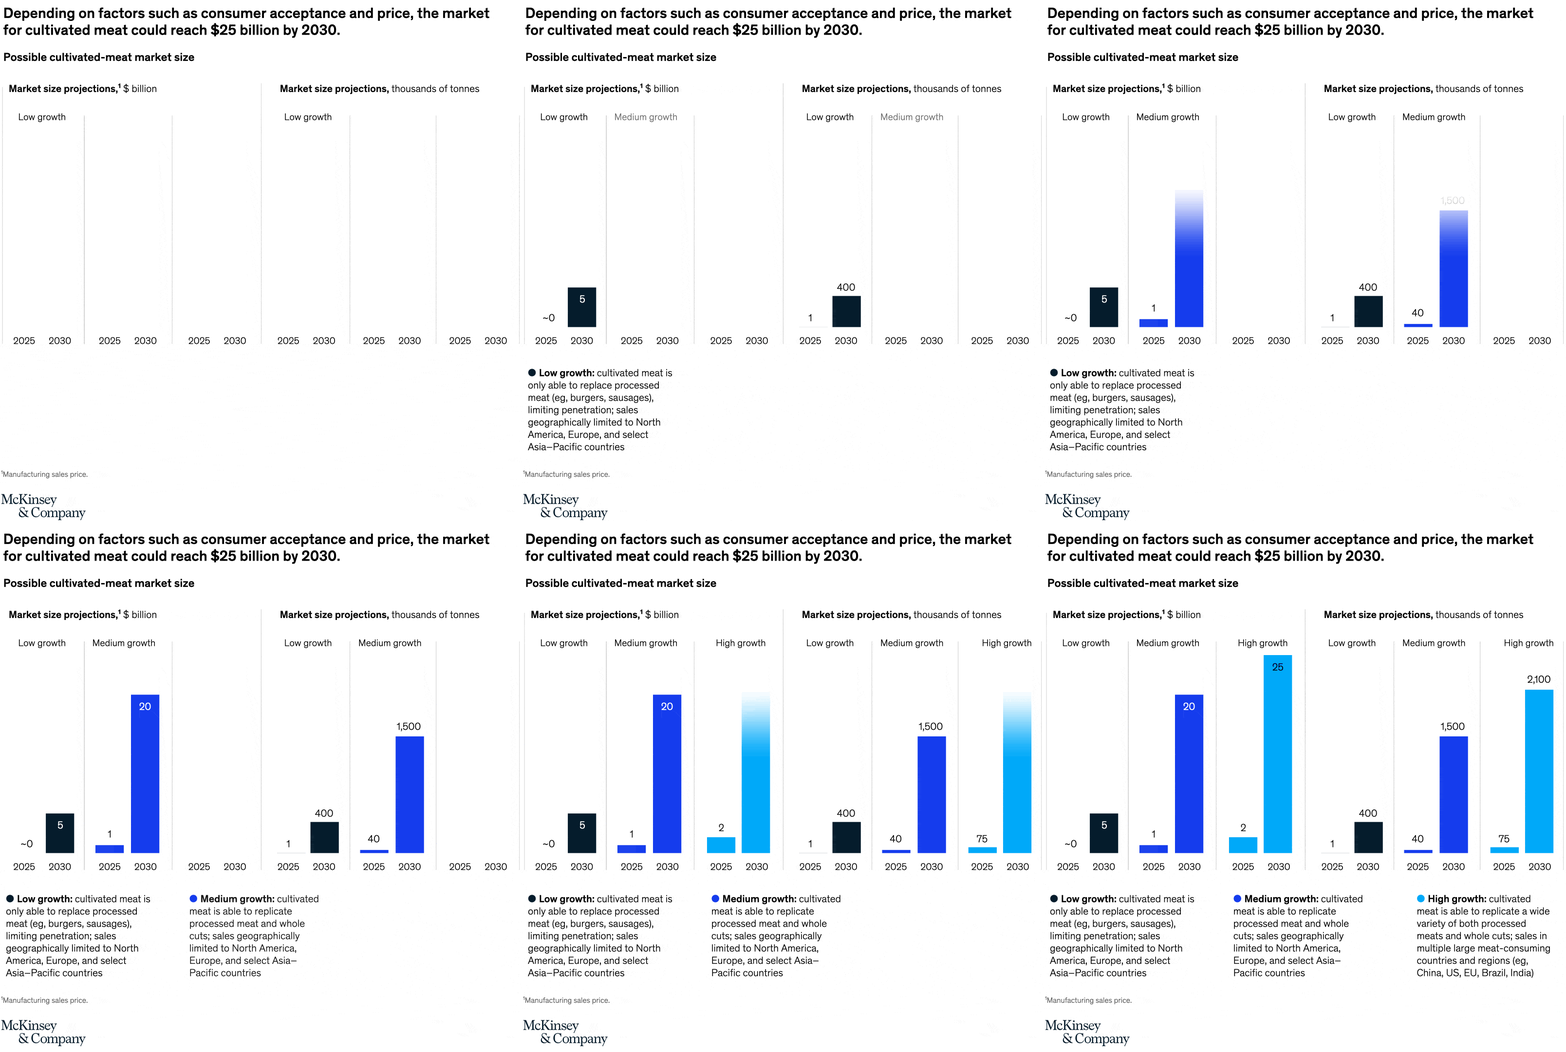
July 1, 2021 – Today, the world primarily eats the meat of animals that are the easiest to farm industrially. Tomorrow, cultivated meat grown from cell lines from specific animals with the best traits, such as Wagyu beef or wild salmon, could be on plates worldwide. If consumers take to these products, the market for cultivated meat could reach $25 billion by 2030.
To read the article, see “Cultivated meat: Out of the lab, into the frying pan,” June 16, 2021.
customizer here
Visual form
Two-panel scenario bar chart.
Layout / body structure
The chart is split into two matched bar-chart panels, one for market value in dollars and one for market volume in thousands of tonnes. Reader scans the three scenario groups from left to right in the first panel, then repeats the same low, medium, and high growth comparison in the second panel, using the short 2025 bars and taller 2030 bars inside each scenario.
What is being compared
The chart compares low, medium, and high growth scenarios for the cultivated-meat market in both dollar value and production volume, showing how each scenario could develop between 2025 and 2030.
Measurement system
The left panel measures market size in billions of dollars, and the right panel measures market size in thousands of tonnes. Each scenario contains a 2025 bar and a 2030 bar labeled directly, so the reader can compare both the time jump and the spread between scenarios.
Visible structure inside the graphic
In each panel, the scenarios are separated into three labeled columns with paired vertical bars inside each one. Dark bars mark the low-growth case, a deeper blue marks medium growth, and a lighter bright blue marks high growth, with the 2030 bars towering over the much shorter 2025 bars.
Main takeaway from the visual
The chart makes the scenario spread very explicit: by 2030 the cultivated-meat market remains small in the low-growth case but becomes dramatically larger in the medium- and high-growth cases. The rightward shift from low to high growth produces a much steeper jump in tonnage and in dollar value than the 2025 starting points suggest.
Key standout values or extremes
On the dollar side, the low-growth case rises from roughly zero in 2025 to 5 billion in 2030, the medium case rises from 1 to 20, and the high case rises from 2 to 25. On the tonnage side, the scenarios rise from 1 to 400, from 40 to 1,500, and from 75 to 2,100 respectively.
Controls / sequence, when applicable
This is a static chart image with no in-chart controls to operate.
Companion media, when applicable
There is no separate companion audio or video; the chart image is the full visual on this page.