Source page: McKinsey & Company
Commentary
A new look at how national economies work
Economy | Strategy
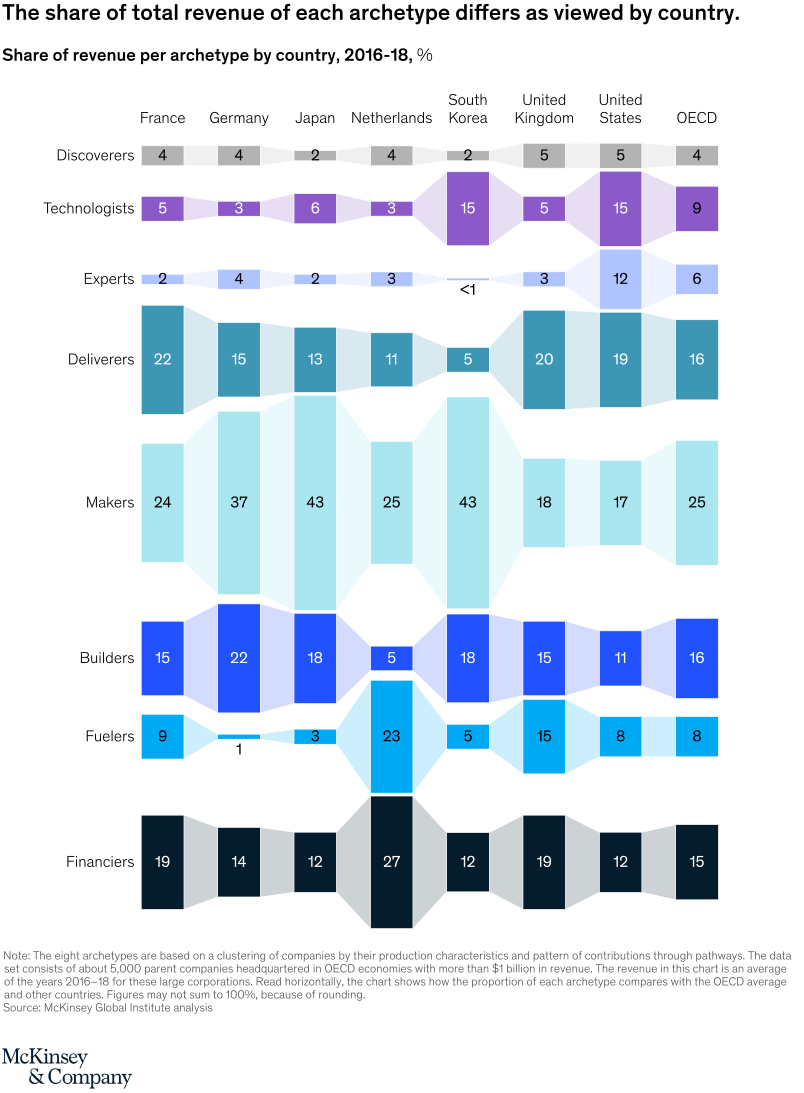
June 28, 2021 – McKinsey Global Institute looked at the value generated by eight kinds of companies. Worldwide, the patterns are quite different. One example: “Makers” are by far the biggest value creators in Germany, Japan, and South Korea. The United States gets more balanced contributions from the corporate sector, including a big push from Technologists.
To read the discussion paper, see “A new look at how corporations impact the economy and households,” May 31, 2021.
customizer here
Visual form
Archetype-by-country banded matrix chart.
Layout / body structure
The chart is a single country comparison matrix with archetype rows and country columns. Reader moves row by row across Discoverers, Technologists, Experts, Deliverers, Makers, Builders, Fuelers, and Financiers, using the connected colored bands and centered labels to compare how each archetype’s share changes from France through the OECD average.
What is being compared
The chart compares the share of total revenue accounted for by eight corporate archetypes across France, Germany, Japan, the Netherlands, South Korea, the United Kingdom, the United States, and the OECD benchmark.
Measurement system
The measurement is percent share of revenue. Every cell is labeled directly with a percentage, and the varying band thickness across each row makes the relative weight of that archetype easy to compare from country to country.
Visible structure inside the graphic
Each archetype forms a horizontal colored band broken into country columns, with the band swelling or narrowing according to the percentage shown in that cell. The row colors distinguish archetypes, while the centered numbers, such as 43 for Makers in Japan and South Korea or 27 for Financiers in the Netherlands, provide exact anchors.
Main takeaway from the visual
The mix of archetypes differs substantially by country rather than clustering around a single universal pattern. Maker-heavy countries stand out with very thick bands in Japan and South Korea, while the Netherlands shows unusually large Financiers and Fuelers shares and the United States shows stronger Experts and Technologists than many peers.
Key standout values or extremes
Makers reach 43 percent in both Japan and South Korea, while Financiers peak at 27 in the Netherlands. Technologists rise to 15 in South Korea and the United States, Deliverers are as low as 5 in South Korea, and Experts fall below 1 in South Korea while reaching 12 in the United States.
Controls / sequence, when applicable
This is a static chart image with no in-chart controls to operate.
Companion media, when applicable
There is no separate companion audio or video; the chart image is the full visual on this page.