Source page: McKinsey & Company
Commentary
The soft underbelly of postpandemic businesses
Digital | Technology
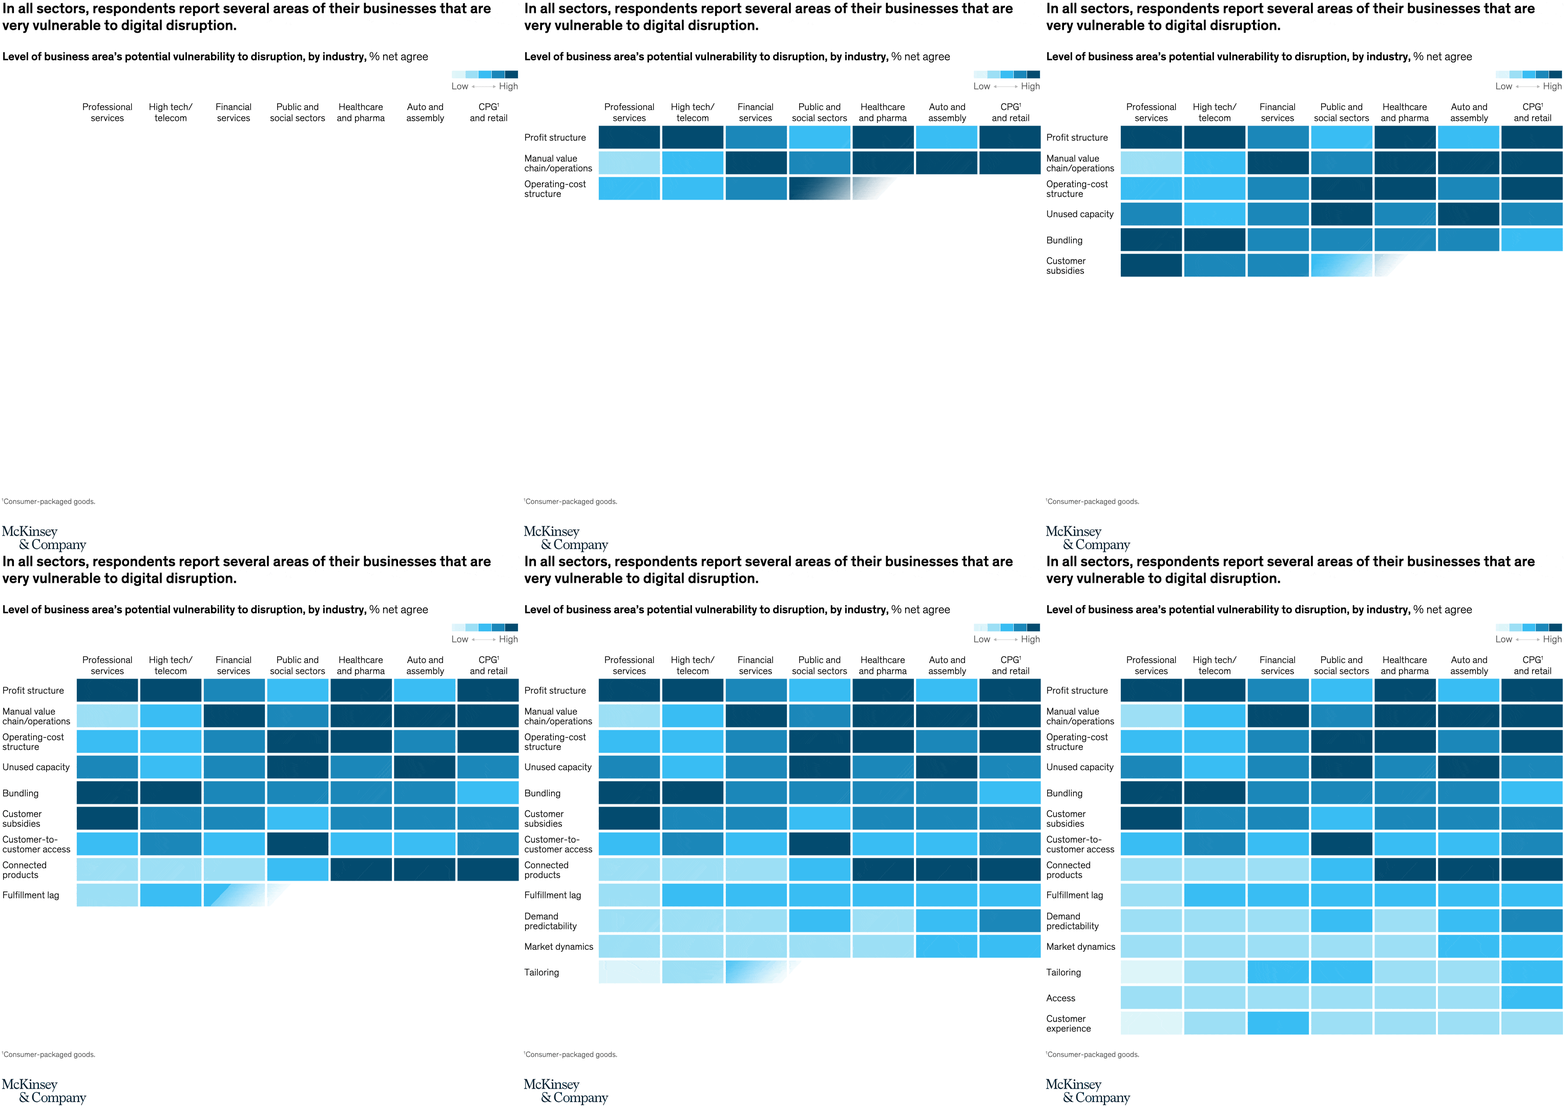
June 23, 2021 – In our newest McKinsey Global Survey on digital strategy, more than a thousand global business leaders pinpointed the soft spots in their businesses where digital disruption poses the biggest threat. Profit structures, the ability to bundle products and services, and operations worry executives the most.
To read the article, see “The new digital edge: Rethinking strategy for the postpandemic era,” May 26, 2021.
customizer here
Visual form
Industry-by-function heat map.
Layout / body structure
The chart is one large matrix with business-vulnerability categories running down the left side and seven industries running across the top. Read across each row to compare sectors on one vulnerability, then scan down a column to see which weak spots accumulate inside a single industry.
What is being compared
The heat map compares how respondents in professional services, high tech and telecom, financial services, public and social sectors, healthcare and pharma, auto and assembly, and consumer-packaged-goods and retail rate the vulnerability of specific business areas to digital disruption. Those business areas include profit structure, manual value-chain operations, operating-cost structure, unused capacity, bundling, fulfillment lag, connected products, customer experience, and several others.
Measurement system
The measure is percent net agree, encoded through a five-step color scale from low to high. There is no numeric value printed inside each cell, so the reader uses relative shade intensity and the legend at the top right to judge where vulnerability is light, moderate, or dark.
Visible structure inside the graphic
Each cell is a colored square, and the darkest navy cells cluster in different places by industry and business function. Profit structure forms one of the darkest rows across the whole matrix, while rows such as fulfillment lag, demand predictability, and customer experience stay lighter and therefore read as less vulnerable on this page.
Main takeaway from the visual
The chart argues visually that no sector escapes digital vulnerability, because every industry column contains several medium-to-dark cells rather than a single isolated hot spot. The biggest common pressure point is profit structure, while healthcare and pharma, auto and assembly, financial services, and CPG and retail each show multiple dark cells that make their exposure feel broad rather than narrow.
Key standout values or extremes
No exact cell values are printed, so the strongest anchors are the darkest cells themselves. Profit structure is among the deepest-shaded cells across most sectors, connected products turns especially dark in healthcare and pharma and in auto and assembly, and manual value-chain operations also reads as very dark in several industries, whereas customer experience and demand predictability remain noticeably lighter in much of the grid.
Controls / sequence, when applicable
This is a static chart image with no in-chart controls to operate.
Companion media, when applicable
There is no separate companion audio or video; the chart image is the full visual on this page.