Source page: McKinsey & Company
Commentary
Dollars (and dinars) for digital
Digital | Technology
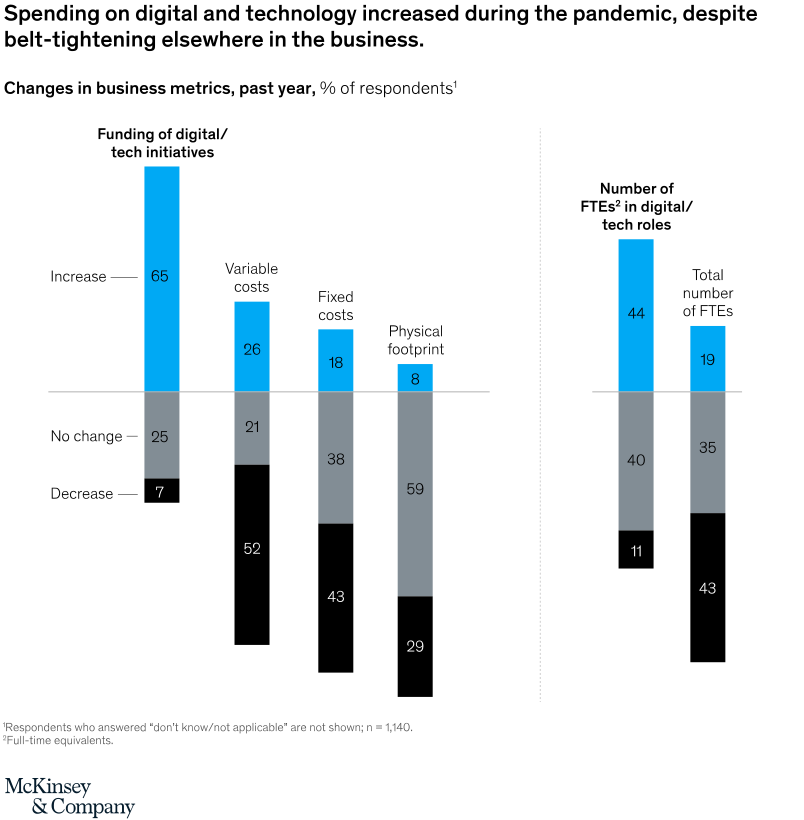
June 17, 2021 – Our latest McKinsey Global Survey on digital strategy asked business leaders about changes in investment during the pandemic. Companies tried to cut costs everywhere—except digital and technology, where most increased their spending.
To read the survey, see “The new digital edge: Rethinking strategy for the postpandemic era,” May 26, 2021.
customizer here
Visual form
Split stacked-bar comparison.
Layout / body structure
The chart is divided into two zones separated by a dotted vertical divider: four stacked columns for business-metric changes on the left and two stacked columns for digital-tech headcount changes on the right. Read the four business metrics first from left to right, then cross the divider and compare the two headcount columns.
What is being compared
The chart compares how respondents say funding, costs, and physical footprint changed during the past year and then compares how digital-tech full-time-equivalent counts changed relative to total FTEs. The left panel covers funding of digital and tech initiatives, variable costs, fixed costs, and physical footprint; the right panel covers number of digital-tech FTEs and total number of FTEs.
Measurement system
Each column is a three-part stack that splits respondents into increase, no change, and decrease. Blue segments mark increases, gray segments mark no change, and black segments mark decreases, with percentages printed directly inside each segment.
Visible structure inside the graphic
All six columns sit on the same horizontal baseline, so categories with positive momentum rise above the line while categories dominated by cuts extend downward in black. The digital-funding bar towers upward, cost bars lean downward, and the right-side FTE pair makes the contrast between expanding digital roles and shrinking overall headcount visible in one glance.
Main takeaway from the visual
Companies cut costs and physical footprint during the pandemic, but digital and technology spending moved in the opposite direction. The chart makes that reversal unmistakable because digital-tech funding and digital-tech FTEs have the largest blue increase segments while variable costs, fixed costs, physical footprint, and total FTEs all show much larger black decrease segments.
Key standout values or extremes
Funding of digital and tech initiatives shows 65 percent reporting an increase and only 7 percent a decrease, the strongest positive skew on the page. By contrast, variable costs show 52 percent decrease versus 26 percent increase, fixed costs show 43 percent decrease versus 18 percent increase, physical footprint shows 59 percent no change with 29 percent decrease, digital-tech FTEs show 44 percent increase versus 11 percent decrease, and total FTEs show 43 percent decrease versus 19 percent increase.
Controls / sequence, when applicable
This is a static chart image with no in-chart controls to operate.
Companion media, when applicable
There is no separate companion audio or video; the chart image is the full visual on this page.