Source page: McKinsey & Company
Commentary
The fountain of youth
Wealth management | North America
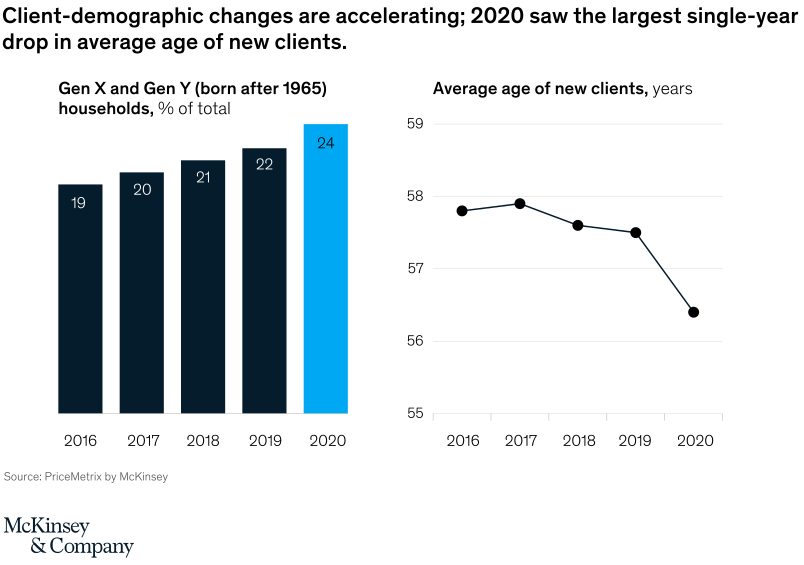
June 11, 2021 – North American wealth management proved remarkably resilient in 2020 due to surging markets and the rise of next gen investors. Clients born after 1965 now represent 24 percent of the total. The surge in youthful investing caused the largest single-year decline in average age of new clients in the ten years we’ve been publishing our annual report.
To read the article, see “The value of personal advice: Wealth management through the pandemic,” May 25, 2021.
customizer here
Visual form
Two-panel bar-and-line comparison.
Layout / body structure
The chart is split into a left bar chart and a right line chart. Read the left panel first to see the share of Gen X and Gen Y households among new clients over time, then read the right panel to see how the average age of new clients changed over the same years.
What is being compared
The chart compares two related demographic shifts among new wealth-management clients from 2016 through 2020: the share of new clients coming from Gen X and Gen Y households, and the average age of new clients. It therefore compares composition change and age change over the same five-year period.
Measurement system
On the left, the bars show percent of total new clients, with values printed directly inside each bar. On the right, the line chart shows average age in years on a vertical scale from 55 to 59, with one point for each year from 2016 to 2020.
Visible structure inside the graphic
The left panel uses five vertical bars that climb step by step from 2016 to 2020, while the right panel uses a five-point line that stays fairly flat for several years and then drops more sharply at the end. The shared year sequence across both panels makes it easy to read the youth shift as a rising share of younger households paired with a falling average age.
Main takeaway from the visual
Younger households are making up a larger share of new clients, and 2020 marks the sharpest one-year drop in average age on the page. The two panels reinforce each other: as the Gen X and Gen Y share rises steadily, the average client age trends downward and then falls more visibly in the final year.
Key standout values or extremes
The share of Gen X and Gen Y households rises from 19 percent in 2016 to 24 percent in 2020. Over the same period, the average age of new clients falls from roughly 57.8 years to about 56.4 years, with the biggest single-year decline occurring from 2019 to 2020.
Controls / sequence, when applicable
This is a static chart image with no in-chart controls to operate.
Companion media, when applicable
There is no separate companion audio or video; the chart image is the full visual on this page.