Source page: McKinsey & Company
Commentary
Equity trading’s race to zero fees
Wealth management | North America
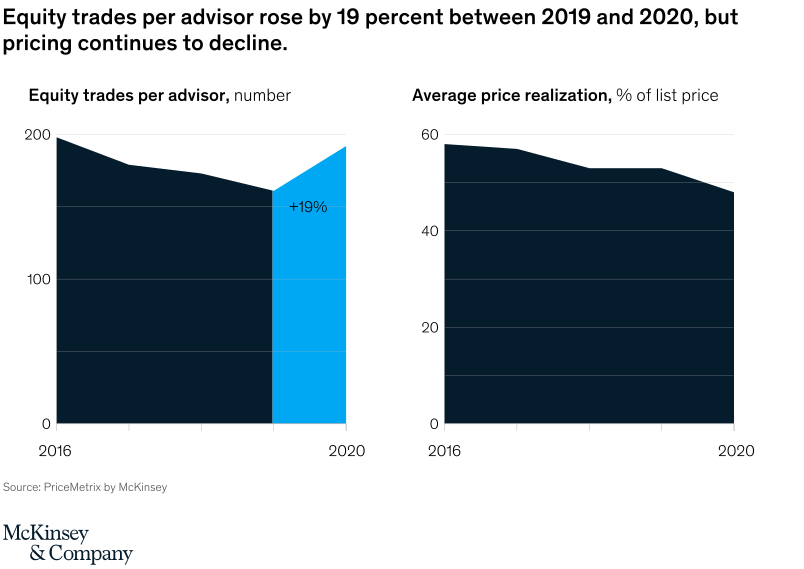
June 4, 2021 – Retail investing in 2020 was a story of “Reddit bros” pushing up meme stocks on new zero-cost trading platforms. But beyond the headlines, advisor-based retail investing also jumped, up 19 percent. However, those zero-commission platforms are making their presence felt; advisors now charge less than half of their list price.
To read the article, see “The value of personal advice: Wealth management through the pandemic,” May 25, 2021.
customizer here
Visual form
Two-panel filled area comparison.
Layout / body structure
The chart is split into two side-by-side panels sharing the same time span from 2016 to 2020. Read the left panel first for equity trades per advisor, then the right panel for average price realization, following the filled area from the 2016 starting point to the 2020 endpoint in each panel.
What is being compared
The chart compares two different but related advisor-economics measures over time: the number of equity trades per advisor and the average price realization as a percent of list price. It shows how trading activity and pricing moved between 2016 and 2020.
Measurement system
The left panel measures trades per advisor on a vertical scale up to 200, while the right panel measures average price realization on a vertical scale up to 60 percent of list price. The filled dark area shows the level through time, and the blue highlight at the 2020 end of the left panel marks the net increase in trades.
Visible structure inside the graphic
Both panels are drawn as filled areas rather than thin lines, which makes the changing shape of each metric feel broad and continuous across the period. The left panel slopes down for several years and then jumps back up into a blue 2020 endpoint, while the right panel drifts downward in a steadier decline toward the 2020 finish.
Main takeaway from the visual
Equity trading activity per advisor increased by 2020, but pricing power kept eroding at the same time. The side-by-side layout makes the contrast explicit: the trades panel ends above its 2019 level with a positive highlighted change, while the price-realization panel ends at its lowest point on the page.
Key standout values or extremes
The left panel calls out a plus 19 percent change in equity trades per advisor between 2019 and 2020, with the series recovering to roughly the high-180s or around 190 by 2020 after falling earlier in the period. The right panel starts near 58 percent of list price in 2016 and declines to about 48 percent by 2020, a drop of roughly 10 percentage points over the period.
Controls / sequence, when applicable
This is a static chart image with no in-chart controls to operate.
Companion media, when applicable
There is no separate companion audio or video; the chart image is the full visual on this page.