Source page: McKinsey & Company
Commentary
Expecting the unexpected
Strategy | Economics
May 19, 2021 – Disruptions due to global economic uncertainty, natural disasters, and other catastrophic events are rising in frequency. Companies can take measures to improve their resilience and emerge stronger from unprecedented change.
To read the article, see “The resilience imperative: Succeeding in uncertain times,” May 17, 2021.
customizer here
Visual form
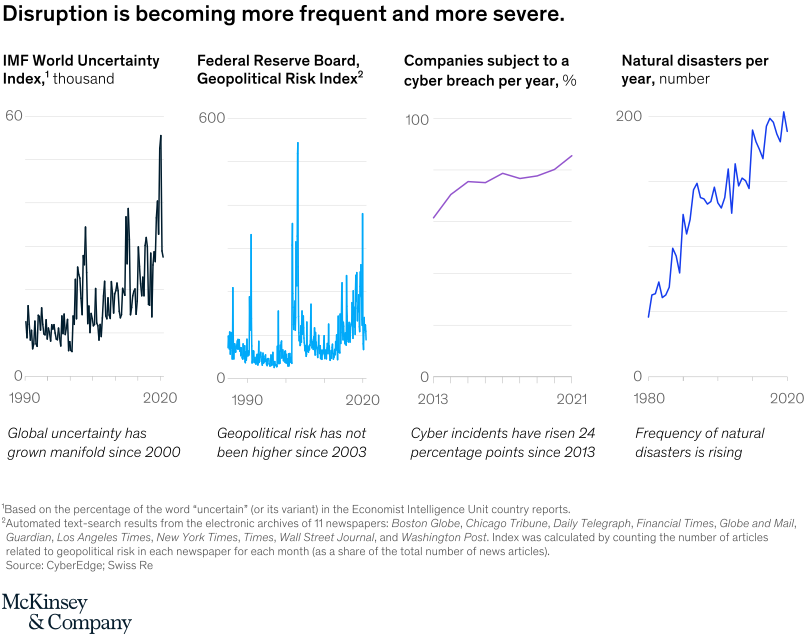
Four-panel small-multiple line chart.
Layout / body structure
The page places four separate time-series panels side by side, each with its own scale and caption. Read from left to right across uncertainty, geopolitical risk, cyber breaches, and natural disasters, then use the short notes beneath each panel to lock in the directional story.
What is being compared
It compares four different kinds of disruption over time: the IMF World Uncertainty Index, the Federal Reserve Board Geopolitical Risk Index, the share of companies hit by a cyber breach, and the annual number of natural disasters.
Measurement system
Each panel uses its own unit: the uncertainty index is shown in thousands, geopolitical risk uses an index scale, cyber incidents are measured as a percent of companies per year, and natural disasters are measured as counts per year. The reader tracks slope and peak level within each panel rather than comparing raw values across panels.
Visible structure inside the graphic
Every panel contains a single line with labeled axes and a short interpretation beneath it. The four aligned panels create a dashboard-like layout where the eye can compare pattern shapes, spikes, and end-of-series levels across very different kinds of disruption.
Main takeaway from the visual
The chart shows that disruption is not isolated to one domain. Uncertainty, geopolitical risk, cyber exposure, and natural disasters all trend toward higher or more volatile readings, which makes the overall risk environment look broader and more persistent.
Key standout values or extremes
The cyber panel explicitly notes a 24 percentage-point rise since 2013. The natural-disaster series climbs toward roughly 200 events a year, while the uncertainty and geopolitical-risk panels show pronounced late-period spikes that sit well above earlier levels.
Controls / sequence, when applicable
This is a static chart image with no in-chart controls to operate.
Companion media, when applicable
There is no separate companion audio or video; the chart image is the full visual on this page.