Source page: McKinsey & Company
Commentary
The changing gas station
Mobility | Oil & Gas
May 14, 2021 – The business mix at gas stations (or forecourts) is set for a shake-up. Demand for fuel looks likely to drop, but owners can expect to sell more food and convenience items. And investing in EV charging facilities could be a winner.
To read the article, see “Fuel retail in the age of new mobility,” McKinsey & Company, April 1, 2021.
customizer here
Visual form
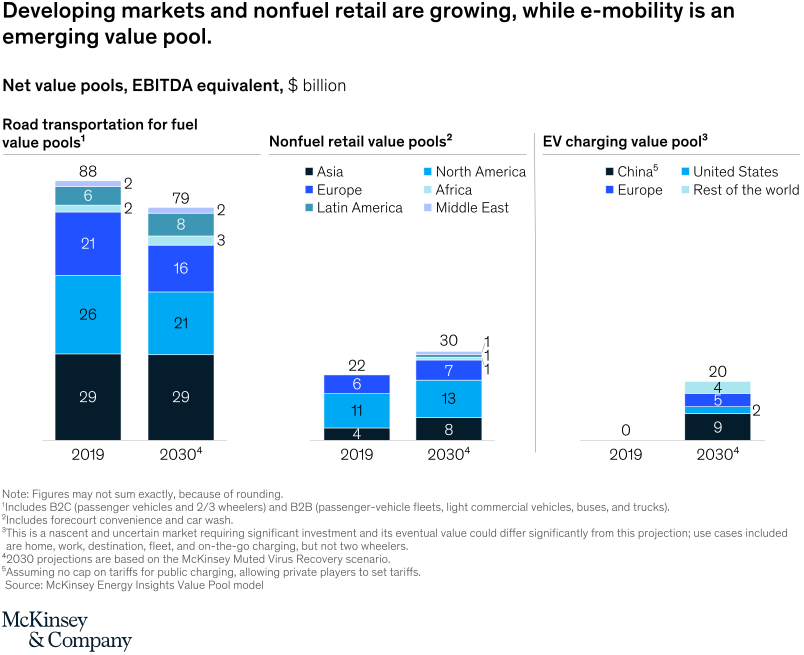
Three-panel stacked column chart.
Layout / body structure
The chart is split into three vertical sections laid out left to right: road transportation fuel value pools, nonfuel retail value pools, and EV charging value pool. Each section places a 2019 column next to a 2030 projection, so the reader scans across the three businesses while also comparing past and projected totals within each one.
What is being compared
It compares the size and regional mix of gas-station-related value pools across fuel retail, nonfuel retail, and EV charging. Within each business, the chart contrasts 2019 with 2030 and shows how Asia, North America, Europe, and smaller regional slices contribute to each total.
Measurement system
The values are net value pools measured in EBITDA-equivalent billions of dollars. Totals are printed above the stacks, and each colored segment is labeled with its own regional contribution inside or beside the bar.
Visible structure inside the graphic
The fuel and nonfuel sections each use two stacked columns, while the EV section shows a zero baseline in 2019 and one projected stack in 2030. The repeated stack format makes it easy to compare how large the overall pools are, which regions dominate them, and where new growth is appearing.
Main takeaway from the visual
Traditional fuel value pools stay large but shrink, nonfuel retail grows, and EV charging appears as a meaningful new pool by 2030. The visual makes the shift feel structural because the rightmost EV column goes from zero to a clearly visible stack while the fuel total drops from its earlier peak.
Key standout values or extremes
Fuel falls from 88 billion dollars in 2019 to 79 billion in 2030, nonfuel retail rises from 22 to 30, and EV charging grows from 0 to 20. In the 2030 EV stack, China is the largest slice at 9, followed by Europe at 5, the rest of the world at 4, and the United States at 2.
Controls / sequence, when applicable
This is a static chart image with no in-chart controls to operate.
Companion media, when applicable
There is no separate companion audio or video; the chart image is the full visual on this page.