Source page: McKinsey & Company
Commentary
Don’t stick together
COVID-19 | Travel | Europe
May 6, 2021 – In before times, Spain was a mecca for world travelers. When they return, it’s more likely that they’ll come in ones and twos, rather than large groups.
To read the article, see “Spain’s travel sector can’t afford to wait to recover. What can stakeholders do?”, April 23, 2021.
customizer here
Visual form
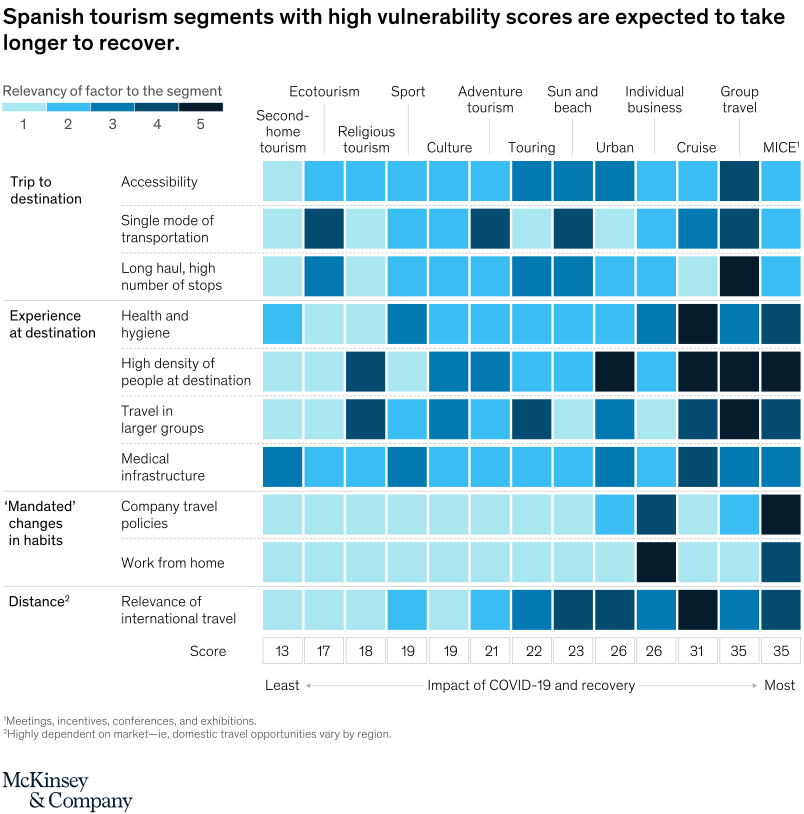
Heatmap matrix with a ranked score row.
Layout / body structure
The chart is one large grid with tourism segments arranged as columns and vulnerability factors arranged as rows grouped into trip to destination, experience at destination, mandated changes in habits, and distance. Reader uses the color legend first, scans down each factor row across the segment columns, and then reads the bottom score row from least to most exposed.
What is being compared
It compares Spanish tourism segments on how vulnerable they are to different recovery obstacles such as accessibility, transport mode, long-haul travel, health and hygiene, crowd density, larger-group travel, medical infrastructure, business-travel policies, work from home, and dependence on international travel.
Measurement system
The cell colors use a five-point relevance scale, with lighter shades representing lower relevance and darker shades representing higher relevance. A numeric score at the bottom of each column aggregates the pattern into one ranked vulnerability figure for that tourism segment.
Visible structure inside the graphic
Each segment column stacks the same set of colored factor cells, which makes it easy to compare where the darkest concentrations collect. The row group labels on the left organize the drivers, and the bottom score row turns the color patterns into an ordered summary running from the least affected segments on the left to the most exposed on the right.
Main takeaway from the visual
Tourism segments tied to business travel, cruises, group travel, and meetings and trade shows sit on the most vulnerable end of the recovery spectrum, while ecotourism and second-home tourism sit at the least exposed end. The concentration of darker cells in the rightmost columns makes the recovery drag look structural rather than isolated to one factor.
Key standout values or extremes
The lowest score shown is 13 for ecotourism, followed by 17 for second-home tourism, while the highest scores are 35 for group travel and 35 for MICE. Cruise reaches 31, individual business and urban tourism sit at 26, sun and beach is 23, and touring is 22, which shows how sharply the exposure rises as the chart moves rightward.
Controls / sequence, when applicable
This is a static chart image with no in-chart controls to operate.
Companion media, when applicable
There is no separate companion audio or video; the chart image is the full visual on this page.